“Don’t boil the ocean!” You might have heard this warning-like phrase.
It originates from the literal concept of boiling the ocean, an impossible task. The phrase serves as an advice to not make a task difficult by doing it too thoroughly.
Over time, this advice has become very popular in industry. In consulting, the phrase is something of a blanket–rule that suggests prioritising rather than analysing all the data at hand to arrive at an answer.
Sounds logical, right?
But is this advice equally applicable to ALL?
This advice applies well to large corporations that have such humongous amounts of data, that it is practically impossible to analyse everything. Analysing all the available data to them is akin to “boiling the ocean.” It is time-consuming, costly, and impractical.
So, it totally makes sense for large businesses to “Don’t boil the ocean.”
But, for startups and small & medium businesses (SMBs), it doesn’t make any sense!
For instance, if a small startup is assessing their product market fit (PMF), they must extract every ounce of insight from the little data they have to correctly validate their hypotheses. For them, the data is yet to assume the size of an ‘ocean.’ So, it is perfectly fine for them to try to analyse everything – quantitatively, qualitatively, and contextually – to make the right decisions. Ignoring any data point at initial stages could be the difference between eliminating and selecting their right target customers (or death and growth).
Likewise, for SMBs with small databases, it seems sensible to not follow “Don’t boil the ocean.”
We have experienced this first-hand in our studies for mid-sized clients. Quite often, some nondescript looking data point turns out to be invaluable.
Also, being manically thorough or proverbially speaking boiling the ocean has its own advantages.
Examples galore from every conceivable field, of people becoming exceptionally successful because of being painstakingly thorough.
In fact, it is the only way to be sure of achieving success at anything.
Is it for you?
Then why do many (small) businesses take “Don’t boil the ocean!” as gospel truth?
They do so for three reasons:
1. Propensity to imitate larger successful businesses. When smaller businesses imitate their larger competitors, they are unwittingly doing a favour to their larger competitors. By doing “Don’t boil the ocean,” they are likely to miss on good insights, make wrong decisions, become less competitive, and as a result, miss on becoming a real threat to their competitors.
2. Lack of intent, energy, time, and resources to put in the grunt-work. Let us accept the fact. If you want to be extremely thorough at what you do, you must be prepared to spend disproportionately more time – your time – doing the task. And guess what – it is back-breaking work. Not everybody is willing (or has the energy, time, and resources) to put in the grunt-work. For them, advice like “Don’t boil the ocean” gives a smart-sounding escape. After all, you don’t know what you don’t know.
3. Misplaced priorities. Being thorough correlates with beingeffective. “Don’t boil the ocean” correlates with being efficient. Your first priority as an SMB is to be more effective in addressing your customers’ needs. In today’s information age, deep understanding about your customers and business makes you more effective. If you misplace this priority at the onset, you might end up being efficient in doing the wrong things.
So, Entrepreneurs and Small Business Owners, don’t fall in the trap of management consulting jargon. Reset your thinking!
As the famous saying (in Hindi) goes, “Dikhave pe na jao, apni akal lagaao (rough translation: don’t blindly follow Norself, think for yourself!)”
You are yet to realise your professional and personal goals, So go ahead, and boil the ocean.
If not boil, churn it, get real gems out of it, and enjoy growth!
And large corps: imagine what YOU can achieve if you stop following “Don’t boil the ocean.”
There appears an increasing level of interest among math scientists to work on topics, like machine learning, that are changing people’s lives through its application in business.
“A topic that is attracting more and more attention is mathematical aspects of machine learning. There are many directions; one that interests me is how I could use some of these exciting new tools in my own research. Another very ambitious and noble goal is to create a mathematical theory of machine learning. When does it fail, and when we can we hope for good results?”
— Maryna Viazovska, 2022 Fields Medal winner, in a Q&A with Nature
This Veracle is about how the mathematicians’ work is instrumental in pushing the boundaries of making data-driven decisions in business.
Let us begin with a little fun challenge: Take a look at the four knights on the cover picture. Can you exchange the positions of the black and white knights on the given chess board?
If you can, then you may have it in you to win the Fields medal.
What is Fields Medal and how is it relevant to business?
The Fields Medal is the most* prestigious award a mathematician can receive. The International Mathematical Union presents the medal to young math scientists for outstanding contributions in mathematics. The Fields Medal is only awarded every four years.
The obverse and reverse of the Fields Medal
This year, four mathematicians are the winners of the Fields Medal. They received their awards earlier this month in Helsinki, Finland.
2022 Fields Medal winners
They have earned this distinguished honour for solving or moving closer to solving longstanding “open problems.”
An open problem is a known stated problem which has not yet been solved. It is assumed to have an objective and verifiable solution.
The answers to open problems pave ways for innovative ideas and possibilities. In business context, these answers facilitate, among other things, making business decisions better and faster.
How is their work exciting and significant?
Business decision making has become too complex. Business executives must consider both qualitative and quantitative information to make decisions.
Qualitative information uses subjective judgements. This includes non-quantifiable data such as employee expertise, people attitude towards change, and company culture among other intangible aspects.
However, quantitative information uses data. Now, organisations have too much data available to them. They have data generated by operational transactions, market research, and external sources. Organisations must analyse this exponentially growing data to make decisions. Moreover, they must make many of these decisions in the runtime.
To that end, businesses need more advanced computational algorithms to sift through zettabytes of data to analyse and arrive at useful insights. The conventional techniques are highly time and cost intensive.
This is where work of the Fields Medallists becomes significant.
How does mathematics help business decisions?
This year’s Field Medallists’ works are centred on number theory, probabilistic theory, and combinatorics, among other more intricate topics.
Here are a few examples of business applications of the topics of their work.
Number theory deals with the properties and relationships of numbers.
It has helped in public key cryptography, such as RSA algorithm. This has enabled confidential communications, digital signatures, and secure online transactions for e-commerce companies.
Probability theory is the branch of math concerned with calculating the likelihood of an event. It has numerous applications in business.
From all kinds of risk assessment and modelling (like that for investment and insurance) to sales forecasting, most prediction algorithms use probability theory.
Combinatorics is the study of objects and connections between them. Simply speaking, it has applications wherever we need to arrange things using permutations and combinations.
One can see examples of combinatorics everywhere. It can help in optimising communication networks and logistics. Combinatorics had a crucial role in manufacturing. For example, modular toy manufacturing.
At Veravizion, we help our clients thoroughly understand their customers. The objective is to devise and implement effective marketing strategies for their business growth.
This involves figuring out our customers’ real target customers, understanding their purchase motivations, performing causal analysis, optimising resource allocations, and in general solving their business problems.
In this process, we apply several techniques such as clustering, regression, optimisation, resource planning, and various other statistical analyses. These are based on pure math and statistical concepts like probability theory, combinatorics, and mathematical optimisation.
Are there any areas of business where you think we can consider using math and statistics?
How else does math help businesses?
* The Abel Prize is also regarded as a top award in mathematics. According to the annual Academic Excellence Survey by ARWU, the Fields Medal is consistently regarded as the top award in the field of mathematics worldwide, and in another survey conducted by IREG in 2013–14, the Fields Medal came closely after the Abel Prize as the second most prestigious international award in mathematics.
Analytics is the process of discovering, interpreting, and communicating meaningful patterns in data. It helps us make decisions based on data and hard facts.
Most companies now use analytics to make data-driven decisions. They expect that good insights can really take their business to the next level.
Unfortunately, good insights rarely emerge.
Is analytics all hype then?
Here is a startling finding.
Research by PwC and Iron Mountain indicates that three in four businesses extract little or no advantage whatsoever from using analytics. According to the study, 43 percent of companies surveyed “obtain little tangible benefit from their information,” while 23 percent “derive no benefit whatsoever.”
Now, everyone and their uncle is claiming to use analytics in their business. If it was really useful, the world’s GDP have gone through the roof.
So, why are businesses not able to leverage analytics?
This HBR article and the PwC research discuss the root cause. Both studies point to lack of the right capabilities and competencies required to make good use of the information companies have.
This finding really warrants the question. What capabilities and competencies do we need to extract real value from data?
In fewer words, what makes analytics valuable and beneficial?
The answer is STATISTICS.
Statistics makes analytics insightful.
Analytics without statistics is bland, blunt, and bootless. It is like Ron’s broken wand in (the Harry Potter movie) The Chamber of Secrets.
Analytics without statistics, at best, gives us dull observations like ‘focus on the millennials.’ At worst, we get costly and impractical recommendations like ‘redesign the entire supply chain.’
This lack of benefits from analytics leaves businesspeople disappointed.
An analysis is ‘insightful’ when it goes beyond the superficial. It gives an accurate and deep (hitherto unexplored) understanding about the subject. Besides, an insightful analysis helps us break our long-held beliefs and preconceived notions that hold us back.
Here are two diverse examples of insightful findings.
Example 1: who revolves around whom?
The western world during Aristotle’s time (c. 384 B.C. to 322 B.C.) believed that the Sun revolved around the Earth. For 1,000 years, Aristotle’s view of a stationary Earth at the centre of a revolving universe dominated the studies of the universe. Surya Siddhanta and later Copernicus’ work showed that it was the other way round. That ours is a heliocentric solar system in which the Earth and the other planets revolve around the Sun.
That is insightful.
Example 2: how do you shave?
Gillette first entered the Indian market in 1984. But they failed to sell razors despite trying for many years. They even launched their newest triple-blade system in 2004. However, sales were flat for a long time. Why? Gillette did not understand the Indian consumers. They had tested the product with only a few Indian Students at MIT and hence had missed crucial insights about shaving habits in India. A large part of Indian men did not have access to running water and had longer and thicker hair (than Americans). Based on these enlightening insights, they launched Gillette Guard for the Indian market, tasted success for the first time, and never looked back.
Connecting the dots…
So, how does statistics make analytics insightful?
It does so by employing systematic numerical methods to analyse enormous quantities of data representative of the entire population. Statistics helps us make inferences on the whole population from those in a representative sample. The representative sampling assures that inferences and conclusions can extend from the sample to the overall population.
Ideally, everyone using analytics must incorporate statistical techniques.
But there is one hitch.
In fact, there are three:
Statistics is complex. If there is one subject which is universally hated, it is statistics. Advanced statistics can get overly complicated. If they must, people use only the descriptive statistics which is easier. They tend to stay away from inferential statistics which is responsible for drawing inferences and conclusions.
Use of statistics needs expertise. One needs in-depth understanding of statistics to be able to apply it completely and correctly. Moreover, there are different statistical techniques for different data types. One must identify the right techniques to use depending upon the nature and quantity of data available. Many a times, we need to apply statistics in multiple stages (like the Bonferroni correction) to get more accurate results.
Building expertise takes time and efforts. Naturally, it is costly. It involves having the right people with deep level of knowledge and experience to apply analytics. Most people stop at the basics.
Due to this, it is rare to see use of statistics in analytics. Hence, despite being beneficial for business, useful analytical insights are hard to achieve.
Thus, analytics without statistics is anything but useful. But analytics with statistics is powerful. It delivers meaningful benefits.
That is why, at Veravizion, statistics is the indispensable part of all our analytics and consulting work.
There are several instances where the right kind of analytics (that include statistics) have rendered spectacular results. Analytics is reshaping industries like retail, consumer goods, healthcare, banking, and agriculture, among others. But that is a topic for another Veracle.
What has been your experience of implementing analytics?
We know that inferential statistics helps people to make intelligent and accurate conclusions about a greater population based on analysis results of a small sample. Simply put, we can make estimations about populations based on a small sample of people.
One example: if we met a small group of doctors and find that the cardiologists among them earned more than general physicians, we could infer that cardiologists, generally, earned more than physicians.
Another example: In exit polls, the pollsters ask a small group of people at polling stations about who they have voted. Based on their responses, the pollsters make a generalised estimation on who is likely to win from that constituency.
However, there can be two problems in here.
Isolated evidence
Random variation
Isolated evidence
The problem of isolated evidence happens when we draw inferences based on only a few cases. Such inferences might not be accurate.
Like the above example, if we happen to know only the top cardiologists who earn high salaries, we might be tempted to generalise that all cardiologists earn high salaries. This is because we personally know a few that earn high salaries. Here, we have isolated evidence of only a few known cardiologists that do not represent the entire population of cardiologists.
In case of isolated evidence, we generalise based on known cases. So, there is an element of cognitive bias. Since cognitive biases strongly influence our decisions, we tend to generalise based on these cognitive biases. It influences so much that we look at every evidence in the light of our cognitive biases.
This problem is more likely to occur in the context of personal experiences.
For example, if we do not have a good experience of a certain product (or a service or an institution), we will desist our friend from using it. Ours may be a case of isolated evidence of bad experience with that product (or service or person). Most other people might have had other experiences. In short, our isolated evidence is not enough to conclude whether something is good or bad.
Random variation
The problem of random variation happens when we have insufficient sample data which may not be representative of the population. Here, we are likely to make inaccurate predictions about the entire population based on inadequate data. In such cases, any observed trend is out of randomness.
Random variation is independent of the effects of cognitive and systematic biases. We must aim to collate sufficient data points to nullify the effect of random variation. In general, the larger the sample size, the smaller the effect of random variation on our estimation. As the sample size increases, the random variation decreases, and the estimation accuracy increases.
In the above polling example, the pollsters may survey only a few people from a tiny number of polling stations. The variation thus obtained is more likely to be random than indicative of the entire population.
Don’t they sound the same?
It is easy to confuse between isolated evidence and random variation.
We can even say that isolated evidence is a special case of random variation.
However, there is one key difference.
Isolated evidence is rooted in the form of personal bias. Whereas the random variation comes purely from inadequate sample data.
That is why isolated evidence is more prevalent in people’s personal experiences. So, a friend asking us not to purchase a product is a case of isolated evidence. The star rating of the product on an e-commerce platform is statistical evidence and solves this problem if the rating is given by thousands of unknown people.
So, the next time we are tempted to make a conclusion based on a small sample size, check whether it is statistical evidence, or a case of isolated evidence or random variation.
Online business growth – the easy way or the right way?
Onine business growth is a topic concerning most retailers. How can retailers grow their business in these times? The key message is at the very end.
Consider this scenario.
You are the owner of a mid-sized retail business. You presently sell your product to your customers in physical stores. A typical sale goes like this: Customers show up at your store. They specify their needs, you give options. You counsel, they choose. You pack, they pay, and you complete the transaction.
Thus far, you have been successful in your current brick-and-mortar model. Your business has a loyal customer base. The net profit margin is in the range of 15%-20%. And, the cash flow is good too.
So, you decide to take your business to the next level.
How would you do it?
The answer is ‘yougo omnichannel’.
The internet penetration of above 90% in most developed countries makes it a no-brainer. Among the developing countries, the internet has grown by over 5000% since year 2000 to around 59%. Moreover, customers now prefer to buy in an omnichannel environment.
In omnichannel retail, the focus is on providing seamless shopping experience to the customer across multiple channels. Omnichannel strategy helps you integrate physical store, online store, mobile app, and social media.
In-short, your business growth strategy now revolves around selling online.
To sell online, there are two main options:
Create your ‘own online channel’
Sell through existing ‘online marketplaces’
This decision determines the future course of your business.
Let us dissect each option.
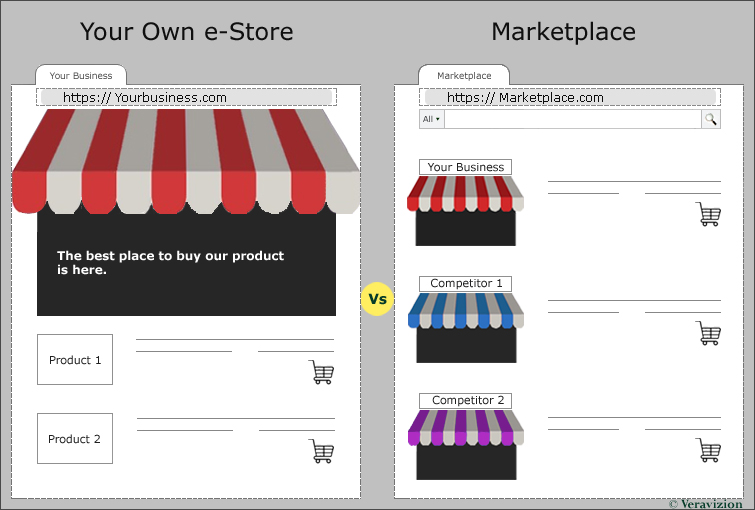
Option-1: Create your own online channel
Creating your own online channel includes two things: first, setting up an e-store – an e-commerce website – to display products and receive customer orders. Second, you need to have an efficient and trustworthy logistics system to fulfil the customer orders. The entire order-to-fulfilment process must run smoothly to give customers a seamless shopping experience.
Having your own online channel has several benefits.
Top three benefits are:
You can create bespoke personalised experience for your customers. It allows you to ensure stronger connection and engagement with them.
You have total control over your business throughout the customer buying process. So, you decide how customers interact with your brand while being on your website. Also, you can create relevant content around your offerings to engage with target customers.
Most importantly, you gain direct access to your customers and their data. You can leverage advanced analytical techniques to analyse this data. This analysis can give you crucial insights about the type of visitors, their visiting trends, and their buying patterns. These insights help you decode the online customer behaviour. Using that, you can make appropriate changes to the way you sell online. This data-driven online selling strategy promises to help you grow your online sales.
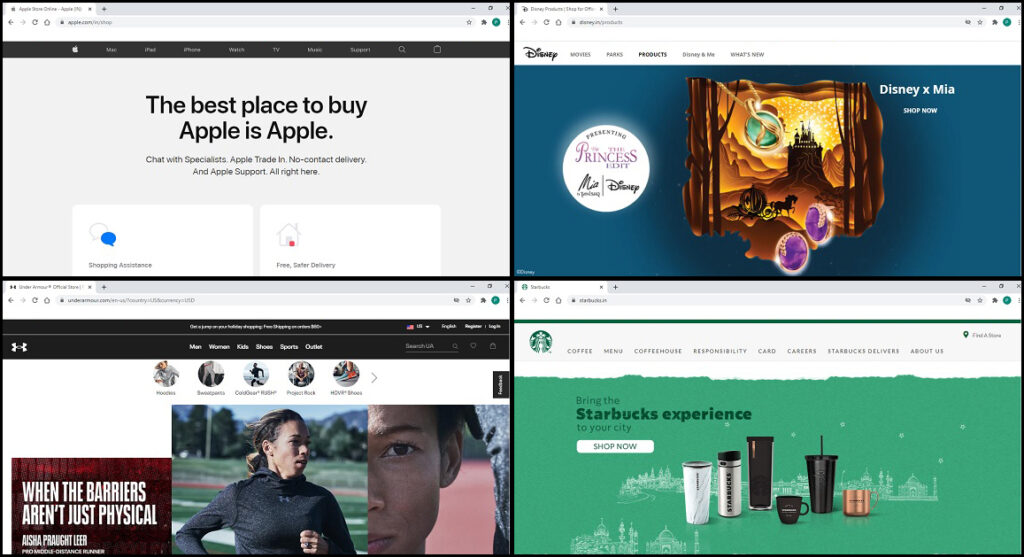
What do top-brands do?
While it is not a surprise that top brands like Apple, Starbucks, Disney, and Under Armour have their own online channels, most mid-size businesses have also launched their own online stores. It helps them create unique customer experience. The successful ones have implemented advanced analytics to reveal insights about their customer buying behaviour.
How top brands ensure unique and enjoyable customer experience through their e-stores
However, a common perception among small retailers is that there are a few disadvantages with this option, viz. higher upfront investment, additional analysis and marketing costs, and higher lead-time for online business growth. Perhaps, that is why, almost one-third of small businesses in the US do not have a website of their own.
That brings us to the second option.
Option-2: Sell through existing ‘online marketplaces’
Online marketplaces allow you to sell products without you having to set up your own online store. The marketplaces host many sellers on their website. Marketplaces are popular among buyers because they allow to buy different products across categories without having to leave the site.
The marketplace owns everything on their website. They take care of the marketing too. In return, you pay them product listing fees and a commission on every product sold.
There are many online marketplaces around. A few are global, some are regional, and many of them are national. The popular ones are Amazon, eBay, Flipkart, AliExpress, Rakuten, Etsy, and Target, amongst many others.
Many retailers tend to choose this second option over the first. It seems easier to them. Ostensibly, they see the following ‘advantages’ in this option – no upfront set-up cost, reduced marketing costs, and no waiting for online business growth.
Except, these advantages hide the real disadvantages.
Let us explain by listing out six key disadvantages of ‘selling through marketplaces’ option:
No Upfront cost = Lose control over sales
You don’t incur upfront cost if you don’t invest in your own e-commerce set-up. Instead, you use the marketplace’s infrastructure to sell. You use their e-commerce applications, their algorithms, and their processes. You depend on them for the sales.
Sure, the sales can increase, but you may not know why. [GE executives recall how Mr. Jack Welch would get angry when the sales went high and they couldn’t explain why.]
In a way, you lose control over your sales process and data to the marketplace.
Why is it a big problem?
Because, if the sales go down, you would be clueless about it. And so, would not know how to fix the problem.
Let us see an example of what it means by not having control.
When you are selling on marketplaces, you cannot control what products are being sold beside yours. Worse, what if the other product looks identical to yours but is from your competitor. Worse still, what if the other product being sold has the same brand-name as yours, but in altogether different category.
It DOES happen!
Here is a real example* of a brand selling at one of the top marketplaces:
The organic soft-cotton baby onesie, is selling alongside
woman’s cocktail dress of the ‘same’ brand-name (but from a competitor); selling alongside
motor flush oil of the ‘same’ brand-name; selling alongside
a music label of the ‘sam-e’ brand-name
– all of them in the same window.
And you cannot do anything about it.
Reduced analysis and marketing costs = Risking business survival
Generally, marketplaces own the data on your product sales. The minute a retailer signs up to a seller’s account on a marketplace, they give permission to the marketplace to use their sales data however they choose. Most marketplaces don’t share that data back with the sellers.
So, in reality, when you choose to sell through a marketplace, you don’t just pay listing fees and a commission per transaction. You also pay with your sales data, and future sales.
[I would re-read that last sentence to let it sink in.]
Marketplaces can use your sales data to gather your customer intelligence. They can leverage it to offer your customers better deals through their in-house labels.
Sellers have shared stories about how this has impacted their business.
In short, you risk losing your loyal customers to your competitors if you do not leverage your sales data yourself.
No waiting for sales-success = Less opportunity to build your brand
Online marketplaces try to make the seller onboarding process easy to bring more offline sellers on their e-commerce platform. They try to make it smooth and quick. You can start selling in a few days [and you may stop selling in fewer days if you violate their policies].
Not just that, you may also start realising sales quickly on marketplaces. However, the presence of many other products makes it difficult for consumer to register your brand among so many others in their minds.
You are successful quickly = Threat of getting undercut on prices
If you start doing really well, someone will notice and one of the two things may happen – they may offer to buy you out or they may undercut you on price and terms, eventually killing you.
Remember Zappos? Zappos was extremely customer-centric, very successful. It was the first company that sold shoes online, at scale. They put a lot of importance on understanding shoes, their culture and customer centricity.
When Amazon wasn’t going anywhere with its own online shoe store, Endless.com, they made their first attempt to acquire Zappos in 2005. Zappos declined. What happened later is not up in public domain. However, Amazon eventually acquired Zappos in July-2009.
Hyper-competitiveness – Forced to sell on price, not differentiation
Conservative estimates put the number of active sellers on Amazon at 2.3 million as of 2019. Chances are, many of them are selling the same products as you do. This makes it difficult for you to compete, if you do not have aggressive [read: less] pricing, that helps the algorithm pick your product ahead of the competitors’.
Diapers.com may be the case in point. They built a $100 million business selling diapers online. They offered free delivery of diapers and other products to parents. But they couldn’t sustain the competitive pressures and ceased to exist in 2017.
Restrictive TnC on how you can communicate with customers = Limits brand building
There may be marketplace limitations on how your business can brand and communicate itself on the marketplace. Moreover, any slightest hint of violating the strict policies will earn you the dreaded ‘seller suspension’ message.
Does that mean marketplaces are bad?
NO! Not at all.
In fact, they have disrupted some aspects of retail for the better.
For example, online shoppers love Amazon. Amazon is allowing them to have wider selection, shop-anytime-anywhere convenience, and enjoyable shopping experience, all at a cheaper price. They have developed a world-class e-commerce platform over the years.
Marketplaces can be good for small retailers, that do not have resources to have their own e-store. Also, marketplaces may be useful for those businesses not aiming to create an enduring brand.
But they may not be for everyone.
You need to figure out whether marketplaces are right for you.
Then, what is the way forward to online business growth?
Companies are waking up to the risk of increasing their dependency on marketplaces. More and more mid- and large-sized companies are embracing “direct-to-consumer” sales model.
Almost all large businesses and brands have their own e-commerce stores. Some of them were tempted initially but then recovered themselves from increasing their dependency on the marketplaces.
Nike – just doing it without a marketplace!
Nike is one such example. Recently, Nike confirmed to CNBC that it will stop selling merchandise directly to Amazon, as part of its push to sell more directly to consumers.
To quote CNBC, “Prior to 2017, Nike had resisted such a deal with Amazon, focusing its attention on its own online marketplace and stores. The fear for many brands has always been that, by partnering with Amazon, a company loses control over how its brand is represented on the site.”
This Veracle makes a point that mid-sized businesses should strive to have their own e-commerce set-up. They should attempt to leverage their sales data using analytics. This could be the right way for their online business growth.
What do you think? Have you seen a mid-sized business struggle with this dilemma?
How are E-Retail KPIs different from traditional Retail KPIs?
What is E-Retail KPI?
E-retail is the online website of a retail store. KPI means Key Performance Indicators. So, the key performance indicators for an online website of a retail store are e-retail KPIs.
Traditional retail is a physical brick-and-mortar retail store. Let’s call their KPIs, traditional retail KPIs.
E-retail and traditional retail by their nature are different. The difference exists from two perspectives: the customer perspective and the retailer perspective.
Let us see the customer’s perspective first.
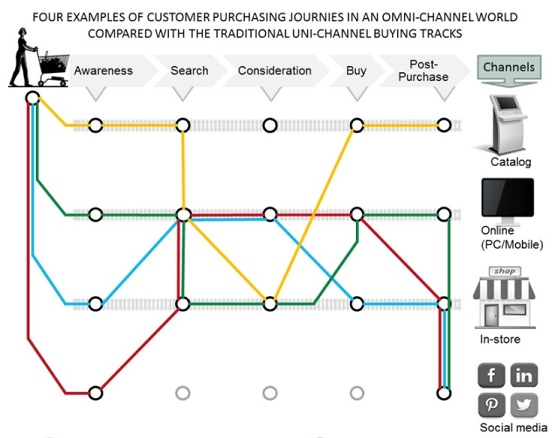
The customer perspective drives their shopping preferences and buying behaviour. For instance, customers who value convenience, price comparison, time-saving, and the ability to shop 24×7 prefer to shop online. Whereas, customers who want to touch, feel, and try the product first tend to shop in physical stores.
Increasingly, customers are buying in an Omnichannel environment. Omnichannel means all channels work seamlessly as one. That is, they discover a product in one channel, check it out in another one, and buy through a third. Such as shown in the figure below.
Omnichannel shopping is becoming the norm
Now, the retailer perspective.
The retailer’s perspective influences their business operating behaviour. Traditional retailers focus on maximizing the in-store experience for their customers while optimizing store space. While e-retailers focus on the online shopping experience and user personalization.
These two perspectives influence their KPIs.
How E-Retail KPIs Differ?
Many e-retail KPIs are common with traditional KPIs. Some of these are the various financial ratios, customer retention, and conversion rate. However, e-retail KPIs are different from traditional retail KPIs in two major areas:
Customer Acquisition Channels
Customer Shopping Behaviour
Let us see how.
Customer Acquisition Channels
This is the source of customer traffic to your business. Understanding where your customers are coming from is extremely important for business growth.
E-retail channels are primarily organic search, direct search, referral, e-mails, and social media. These channels actually lead customers to e-retail stores (i.e. the website). So, e-retailers can easily measure the percent of customers acquired from these channels. They can then devise their deliberate strategy around these insights.
For example, Facebook generates 13.9% of e-retail website traffic, but actual sale happens in only 4.7% of cases. This is a critical piece of information in two ways: First, it allows you to allocate resources efficiently. Also, it improves ROI.
Traditional retail channels are different.
They are mainly word of mouth or advertisements in print, television, radio, and social media. For traditional retailers, it is nearly impossible to accurately calculate the percent of customers acquired from these different channels. This is because these channels do not ‘redirect’ them to the store.
For example, a customer actually visiting a store may have seen an ad or may have been referred by word of mouth. But, they may not even remember this information when they visit the store.
Customer Shopping Behaviour
Customer behaviour varies a lot between in-store purchases and online purchases. Understanding customer behaviour is central to acquiring more customers.
In e-retail, KPIs like Shopping Cart Abandonment (SCA) and Customer Lifetime Value (CLV) are important and helpful. The analysis of the shopping cart abandonment rate and the list of discarded items can help improve our understanding of the purchase intent of customers. Similarly, understanding a customer’s lifetime value helps in targeting profitable customers more effectively.
Whereas for traditional retail, understanding shopping behaviour for every customer is tricky and costly. We can only perform market basket analysis. This will only analyze the products added together in the cart. But there is no definite way to measure discarded items from carts in the physical stores. Moreover, physical space-oriented KPIs like sales per square foot are not relevant to e-retail.
In a nutshell, it is essential for retailers to rethink the right KPIs while taking the retail business online. This is especially true since omnichannel shopping is becoming the norm.
You can also subscribe to our blog – Veracles – to receive interesting articles and insights in email. We would love to read your perspectives and comments on that.
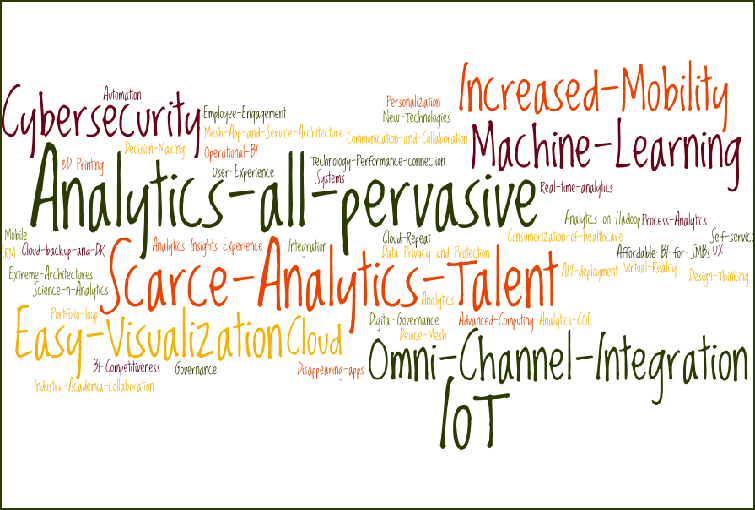
Here are the top analytics trends 2017 for businesses based on what industry and our clients are saying.
These trends reveal a pattern similar to the one observed last year. Embedded BI facilitates the analytics of everything on demand. Moreover, application of IoT devices continues to increase rapidly. Gartner estimates that 20.8 billion connected things will be in use worldwide by 2020.
While analytics, IoT and their applications in business continue to permeate deeper, artificial intelligence (AI) and machine learning (ML) is gaining further attention.
Until a few years back, mid-size organizations hardly considered AI as a possible solution to any of their problems. However, the pressure on margins due to increasing competitiveness fueled by online players is making it imperative for all businesses, big and small, to be more efficient.
Besides analytics, IOT, and AI, there is one interesting trend that silently continues to grow and intensify because of how human beings are evolving – the urgent need for clear, relevant, and crisp visualization of data.
According to a research by scientists, human attention span is shrinking so much that even a goldfish can hold a thought for longer. The study by Microsoft says that average human attention span has fallen from 12 seconds in 2000, (or around the time the mobile revolution began), to 8.25 seconds in 2015.
While the comparison with the attention span of goldfish is debatable, the underlying insight – that humans are less attentive than ever before – hardly is. Powerful visualization of information remains the key.
Another trend catching the attention of businesses is the use of predictive analytics. In today’s uncertain business environment, companies want the ability to forecast future business performance based on the past. Predictive analytics tries to answer questions such as: What is likely to happen tomorrow? How can we make the business improve? Consequently, predictive and prescriptive analytics are among the most discussed analytics trends among the professionals.
In summary, smart businesses are recognizing the contribution of analytics (and the associated technologies) in their ongoing success. The top analytics trends 2017 continue to reflect this new reality. Unfortunately, Business analytics talent is scarce. Companies are struggling to hire (and afford) the right people that will help them realize the true benefits of analytics. This makes it ever-more critical to engage with partners that will bring on-board the right combination of computing know-how, analytical and visualization skills, and business acumen.
So, here are the top analytics trends 2017 at a glance. Do read-on, review and respond.
You can also subscribe to our blog – Our Veracles – to receive interesting articles and insights in email. We would love to read your perspectives and comments on that.
This article isn’t just about the application of analytics in healthcare. It is about how healthcare industry is harnessing analytics to evaluate the latest innovations in healthcare technology. Such as evaluation can help leaders in healthcare make policy decisions about embracing the new technology.
Techno-medical innovations
Over the last couple of decades, there have been quite a few noteworthy technological advancements in healthcare industry. For example, Electronic health records (EHRs); HAART for HIV combined drug therapy; minimally invasive surgery; needle-free injection technology; MRI, genomics; and non-invasive diagnostics.
These innovations are extraordinary because they are disrupting the way healthcare professionals can diagnose and treat patients in a better, faster, and safer way.
One such technological advancement was endoscopic surgery or minimally invasive surgery. This innovation revolutionized the way healthcare surgeons perform surgeries now. Knowledge@Wharton once ranked it tenth among the “Top 30 Innovations of the Last 30 Years” list.
The conventional surgical procedures were highly invasive, riskier, painful, and time-consuming. They required long post-operative hospital stays and longer recovery times. Thanks to technological innovations, today, patients have an option of choosing either robotic surgery or endoscopic (non-robotic) surgery. These new methods result in much shorter recovery times, less pain, and dramatically reduced scarring. This augurs well for patients who are looking to return back to work quickly.
Minimally Invasive Cardiac Surgery
Many hospitals and cardiac care centers worldwide are evaluating the efficacy of the newer – minimal invasive approach – for specific cardiac surgical procedures.
The conventional cardiac valve repair/replacement surgery involved opening up a patient with an 18 to 20 cm vertical incision at the sternum. The newer minimally invasive procedure involves approaching the heart through a much smaller horiontal incision. This incision (or a key-hole) under the right breast is only up to 7cm.
The new cardiac procedures are more complex for surgeons to perform as the area of access (to heart) narrows down drastically compared to the wider access that the conventional surgery allows. Nevertheless, the new procedure is believed to more beneficial. The benefits involve less bleeding, lower risk of infection, faster recovery times, and lesser expenses for patients.
Analytics in Healthcare – A Case Study
Our client# had been studying the effectiveness of the new method of cardiac surgery compared to the conventional way of performing the same procedure. The study allowed them to enroll patients for one of the two types of procedures. This enrolling depended upon a number of physiological and health factors of each patient.
They performed the study over a period of three years and recorded the observations. The observed data included the type of procedure performed along with a number of associated output parameters such as hospital stay duration and pain levels experienced, among many others. We chose a power of 80%; we randomized the data for detailed analysis.
Our analysts collaborated closely with the client to understand the nature and significance of each output parameter. We identified the right statistical tools and techniques to be applied based on the nature and type of the data to analyse. The statistical significance level for the analyses 5%.
The results were examined in detail both for statistical and clinical significance. We cross-checked the statistical test results quantitatively as well as qualitatively with subject matter experts for completeness and correctness in order to arrive at unambiguous conclusions. Each conclusion shared with the client was solidly backed with data. The results would help them make a fact-based policy decision to embrace the newer procedure for their center.
Going beyond the statistical analysis, a predictive model was developed based on the results of the initial study. The predictive model would assist the client in determining the right approach to adopt for a future patient depending upon a number of factors. This is expected to improve the cardiac procedural outcome at the healthcare center.
Application of analytics in healthcare
Predictive modeling using machine learning is a powerful technique that helps in forecasting a probable outcome based on empirical data. Predictive modeling and analytics has tremendous potential in healthcare to improve the overall quality of patient care services. Analytics has shown promise to all the constituents involved in the healthcare sector viz. patients, physicians/surgeons, hospitals, pharmaceutical companies, insurance companies, and public health professionals.
Patients – more aware of self-health
Some of the uses of predictive analytics include increased accuracy of diagnosis, early detection of a disease condition in at-risk patients using genomics, and evidence based medicine. In general, with the proliferation of wearables, patients can be more aware and assured of their own physical conditions.
When a patient is visiting a physician complaining chest pain, it is often difficult for the physician to know whether the person needs hospitalization. If the doctor is using a well-tested predictive diagnostic system, in which he can accurately input the patient’s physical and clinical condition, then the system can assist the physician make an informed judgement.
On the treatment side, a physician can follow a patient’s data (or EHRs) for many years and can prescribe a treatment regime tailored to the patient’s specific condition. As a result, this fact-based treatment reduces the probability of causing any major side effects.
Hospitals – improve patient care with low mortality rates
Like the case study narrated above, predictive analytics can help hospitals and research centers in evaluating the efficacy of various procedures and treatments. This can help in improving the mortality and morbidity rates during the post-op period.
Pharmaceutical Companies – bring new more effective drugs to market faster
Researching a new drug and conducting a clinical trial for the new drug are two very lengthy, costly and resource intensive processes for pharma companies. The R&D process for pharma companies can become more productive by leveraging the power of machine learning to systematically test the mixtures of existing proven molecular components. This may help in identifying new drugs with higher probability for success. Moreover, predictive modeling can be implemented to test the effectiveness of new drugs in a faster and less expensive manner. This will not only help them bring the drug to the market more quickly, but will also reduce the overall healthcare costs per patient significantly.
Insurance Companies – reduce cost of insurance
Healthcare insurance service providers can implement predictive analytics models to better forecast insurance cost for individuals. Presently, the insurance cost is more a function of a person’s age, current medical condition, and the ‘plan’ they are opting for.
Now, advancements in medical technology have made it possible to make genetic information and other healthcare related data easily available. Insurance providers can make use of this information to arrive at future medical expenses for a person. Also, they can make more informed decisions about the insurance costs associated with that individual. This will be a more realistic assessment of insurance needs for a person. Thus, it will be beneficial to both sides in terms of provisions to be made.
Public Health (Professionals)
The World Health Organization defines public health as all privately and publicly sponsored measures to prevent disease, promote health, and prolong life among the population as a whole. Its activities aim to provide conditions in which people can be healthy and focus on entire populations, not on individual patients or diseases. Here, analytics can be implemented in predicting early detection of pandemics and flu outbreaks. GoogleFlu was a project which estimated Flu and Dengue fever based on search patterns. While the project is not publishing anymore, empirical data is available for research purposes.
Conclusion
While application of analytics in healthcare is possible in all spheres of patient care, it is more about leveraging the power of analytics in rapidly evaluating the true value of techno-medical innovations for human benefits. Analytics makes it possible to make fact-based decisions about adopting it. Moreover, it also helps internalizing these latest technological advancements that promises to help us lead a quality life for a few years more.
You can also subscribe to our blog – Our Perspectives – to receive interesting articles and insights in email. We would love to read your perspectives and comments on that.
Like last year, we bring to you top analytics trends 2016 for SMBs. These trends are based on what industry stalwarts and our clients are saying.
A quick comparison with last year’s trends reveals that some trends continue to evolve. Topics like Deep learning, Self-service-BI, or Cognitive computing are some latest ones being discussed. Nonetheless, others are rapidly gravitating towards some common theme.
One such theme is ‘Big Data Analytics’. More and more small and medium-sized businesses (SMBs in short) are going digital. They are embracing analytics and leveraging their data to turn insights into higher revenues, reduced costs, and overall business growth. According to analysts, the big data analytics market is expected to reach nearly $50B by 2019.
Our Trends focus on the applicability of these technologies to small and medium business (SMB) organizations. As we know, technology plays a vital role in running a business successfully. Yet, some of these emerging technologies are not immediately relevant to SMBs. While it can be helpful to develop an awareness of these technologies, very few SMBs are actually going to use them. For example, the uses of 3D printing or AI in 2016.
This year, we have identified nine top analytics trends that are most relevant to SMBs.
1. More SMBs use analytics for business benefits.
Until a few years back, big data (analytics) was more hype than reality. Google was awash with searches involving keywords centered on ‘Big Data’. However, over the last couple of years, analytics has left the hype curve to provide real value. Today, analytics is everywhere.
Earlier, SMBs were not too savvy about maintaining the data of their customers, product orders, and suppliers. This was largely because of the costs involved in the data storage without the apparent benefit of maintaining the data. However, with the data explosion through various media over the last couple of years and with the availability of custom-analytics providers, they woke to the possibility of utilizing their data for getting answers to some key questions around their businesses. As the benefits started becoming visible – in terms of exponential business growth in a few cases – SMBs started focusing on analytics and become more data-driven to improve their business results.
However, making this data meaningful and easy to understand is still a challenge for many. We think that 2016 will be the year that small-scale analytics will really take off for SMBs, as it allows them to leverage their data from disparate data sources for their business benefits.
2. Internet of Things (IoT) enters our daily lives.
“When wireless is perfectly applied the whole earth will be converted into a huge brain, which in fact it is, all things being particles of a real and rhythmic whole… and the instruments through which we shall be able to do this will be amazingly simple compared with our present telephone. A man will be able to carry one in his vest pocket.“
How it has become a reality less than a century later!
The Internet of Things (IoT) in its current form proliferated with the surge in low cost sensors embedded with Bluetooth wireless capability onto a small chip. And it is rapidly evolving from the realm of fascinating gizmos to real-world utility gadgets. Many leading companies such as Google, Amazon, Cisco, Dell, and TI have developed their versions of IoT products. There are already some cool IoT devices like Nest, Fitbit, and Belkin, to name just a few, that are vying for consumers’ attention in the market.
So what’s in it for SMBs?
In terms of Google trends shown in Exhibit-A, IoT today is where big data analytics was around 4-years back. Gartner forecasts that there will be 6.4 billion internet-connected things in 2016. Although the potential of IoT is huge, few SMBs consider it their ‘critical’ priority for investment at the moment. For them, it is still a nice buzzword. There is still time before every visible thing will have a sensor attached to it that will communicate with your servers in real-time. Meanwhile, SMBs are willing to watch and ride the hype-cycle.
3. Predictive analytics to address cybersecurity concerns.
As SMBs expand their technology footprint to run their business operations, the need to secure and protect data grows. Data security and privacy concerns continue to exist among small and large business organizations. However, many SMBs feel challenged and intimidated to deal with the rising complexity of cybersecurity breaches. Companies are normally content with the conventional approach of putting defensive mechanisms to ward off security risks. However, with technology advancements, the security breaches have also become more sophisticated and more risky wherever consumer data is involved.
While large organizations invest heavily into advanced (read: expensive) security mechanisms, SMBs do not have the luxury to do so. Nevertheless, they are now custom-developing predictive analytic models to proactively monitor log files and other user data sources to detect any threat perception or breach alerts. Clustering algorithms can help them identify anomalies in user login or other events which can be recorded on an ongoing basis. 2016 is likely to see an increase in the application of predictive analytics to deal with cybersecurity concerns.
We are entering the ‘smart’ era – smart people working alongside smart machines in smart cities. IDC¹ predicts that companies will spend more than $60 billion on cognitive solutions by 2025. Theoretically, machine learning algorithms based on neural network and AI have existed for a long time. However, their widespread application in everyday life is getting acceptance only now. This is made possible due to the tremendous increase in processing power that enables real-time split-second decision making.
Machine learning algorithms are currently being employed primarily in retail industry. With more people shopping across multiple channels looking for lowest prices, machine learning algorithms will become very popular in implementing dynamic pricing and devising on-the-spot offers in retail stores to retain the buyer.
For example, during this year’s holiday shopping season, leading retailers such as Amazon and Walmart were relying heavily on algorithmic pricing. Both retailers re-priced 15% of 18,000 product SKUs being tracked by a pricing intelligence solution on November 14th alone. These algorithms will be the backbone of any and every e-commerce business striving to win and retain customers.
[Example credit: Forbes]
5. Rising smartphone and tablet penetration continues to increase consumer mobility.
According to a comScore – Morgan Stanley research, mobile users globally have surpassed desktop users at the beginning of 2014. Rising mobile adoption, among people of all ages, impacts consumer purchasing patterns in a big way. With the increasing mobility, SMBs view mobile apps as a way to reach and engage end-users. SMB Group’s 2014 SMB Mobile Solutions Study indicates 59% of SMBs view mobile solutions and services as ‘critical’ to their business.
6. Hybrid cloud options still complex for SMBs.
2015 saw cloud making deep inroads into data-centers, data warehouses, centralized storages, and servers. SMB group’s market study shows that the cloud is poised to overtake on-premises deployment in the next year in areas such as collaboration, file sharing and marketing automation.
However, SMBs are largely using public cloud and staying away from private (or hybrid) cloud options because of the lack of clarity. Microsoft, Dell, and IBM have their own cloud platforms as hybrid cloud options however they do not yet seem to provide a compelling proposition for SMBs to embrace.
7. Omni-Channel integration or cross-device challenge?
Omni-channel is not a buzzword anymore given the availability of multiple screens every customer has. People have indicated that they love to shop across channels. So, more and more brands are going omni-channel way in a bid to woo consumers and to help them buy in their preferred channels. Brands are applying strategies like location based analytics to make relevant offers when consumers are in the vicinity of their stores. Businesses (like Macy’s or Virgin) that offer a unified omni-channel experience to their customers appear to have a competitive edge over others that cannot.
However, in a March 2015 study by Signal, 51% of marketers worldwide reported that they did not have a single view of customers, and only 6% of marketers worldwide reported they had an adequate single view of customers or prospects across all devices and touchpoints.
From our perspective, this year businesses will make this decision of whether they will play the omni-channel game and how.
8. Real analytics talent is (still) scarce.
According to the 2015 MIT Sloan Management Review survey² of business executives, managers and analytics professionals, 49% of respondents, who believe analytics creates competitive advantage for their organization, say that their company lacks appropriate analytics talent. While there is no dearth of analytics CVs in the market, very few of those appear to have real data science skills. In reality, companies need data scientists who possess the rounded knowledge of computer science, algorithms, math-statistics, business, and analytical skills.
Organizations that hire the less than appropriately skilled analysts end up wasting more than just money without any real benefits accrued. This is the reason more than 50% of analytically challenges organizations have stated that they outsource analytical services to external consultants or organizations, according to the survey.
Smart companies are realizing that analytical talent is critical to their success and in short supply, but more than 40 percent struggle with finding the talent they need. There seems to be a growing belief among SMBs that it is best to focus on customers to grow business leaving the necessary analysis tech work to specialists.
9. Visualization will be vital to SMBs application of analytics.
Data and the insights from that data are no more relegated only to the analysts. Business owners and SMB executives want to visualize their data to understand ‘what’s really going on’ in their business. And they want to do it in minimum possible time to be able to focus on the more important aspect of applying those insights for the improvement of their business. Business analytics in the SMB space is likely to stop being just a set of bar- and pie-based charts, and will be more multi-variate and intuitive. SMBs will demand more from the analysts in terms of visualization techniques that makes it easier and faster to visualize, understand, and explore data and uncover real insights from it.
Conclusion
This is an extremely exciting time for SMBs who can now apply customized analytics as per their specific requirements to take their business to a new level in an economical way. We believe this was not an option they previously had. It will be interesting to see how SMBs embrace business analytics to leverage the opportunity and explore unlimited possibilities.
References:
1 International Data Corporation
2 Ransbotham, D. Kiron and P.K. Prentice, “The Talent Dividend: Analytics talent is driving competitive advantage at data-oriented companies,”MIT Sloan Management Review, April 2015.
You can also subscribe to our blog –Our Perspectives– to receive interesting articles and insights in email. We would love to read your perspectives and comments on that.
Thanks for your overwhelming response to our insights shared with you over the last year. We are excited to announce the most popular perspectives from 2015 published at Veravizion/Perspectives. These are our biggest stories of 2015 in case you missed them.
One of the wonderful aspects about sharing our insights is appreciating the incredible business acumen, diversity, and depth of thinking of our readers. Our articles, which we call our perspectives, are written after carrying out thorough research on every topic. Our belief is that these articles will push you into thinking about how the (business) world is transforming before our eyes, and how some long-standing business principles may not necessarily hold true today.
As the year is over, take a quick glance at how the world is getting used to being data-driven. Enjoy these stories and let us know about your top content in the comments. In the next one, we will see how the analytics world is likely to unfold in 2016.
Sports has always had many lessons to share for business success; and everyone and their grandpa knows this. Nevertheless, its relevance has never been as great as it is in today’s analytics age.
This article illustrates this phenomenon by drawing lessons for business success from 2015 Wimbledon final between Djokovich and Federer.
This article on Data Science by Veravizion was originally published as the cover story in the July-2015 edition of Computer Society of India – Communications magazine. You can also read this article at its source at http://www.csi-india.org (Link path: http://www.csi-india.org->PUBLICATIONS->CSI Communications->CSIC 2015->CSIC 2015(July)).“
The business world is fast going online, so what’s the big deal? The big deal is in grasping the fact that it may replace your business if you do not become a part of the change, soon.
The infographic in this article gives a glimpse of how fast the consumer purchasing trends are changing from physical to digital, and what you can do about it.
Historically, leaders of cities, communities, and organizations have been embracing strategic initiatives to ensure long term sustenance and growth of their respective ecosystems. Many a times, these initiatives were ‘intentionally’ directed at bringing about long term transformation of their systems. But do such initiatives specifically aimed at strategic transformation always result in the lasting growth of the entity? We discuss it in this article.
This is the last article in the Digital Business series in which we illustrate how small and medium businesses can transform themselves from mere-physical to also-digital, and be more competitive. We do this by taking a visual example of a fictitious light business of our lovable businessman Bobstick.
You can also subscribe to our blog –Our Perspectives– to receive interesting articles and insights in email. We would love to read your perspectives and comments on that.
“This article reposted here was originally published as the cover story in the July-2015 edition of Computer Society of India - Communications magazine. You can also read this article at its source at http://www.csi-india.org (Link path: http://www.csi-india.org->PUBLICATIONS->CSI Communications->CSIC 2015->CSIC 2015(July))."
Data Science means extraction of knowledge from data. The key word in data science is not data; it is science[1]. Science of something means study of that thing to extract knowledge about it. In most generic sense, the purpose of every data science project is to answer a question (or a set of questions) backed by hard-facts. Academicians and researchers apply scientific principles to get specific answers about a research subject. Similarly, businesses employ data science principles to improve customer engagement, devise growth strategies, optimize operations, and build competitive advantage. This article shares a perspective on what data science really is, how it impacts various industries, what benefits does it offer to organizations – both for-profit and not-for-profit, and what are the key data science trends prevalent today.
DATA SCIENCE: WHAT IT IS (AND ISN’T)
Apparently Peter Naur and John W. Tukey seem to be among the first ones to have treated data analysis within the precincts of science[2]. John W. Tukey, who coined the term ‘bit’, has mentioned it in his 1962 paper ‘The Future of Data Analysis’. In my view, while the term ‘data science’ is relatively young, its application is not. There is an early evidence[3] of 1854, of Dr. John Snow applying scientific principles of data analysis to detect the root cause of The Cholera Epidemic in London. So data science has been around for a while albeit in different forms.
While we tend to associate data science with several other terms such as artificial intelligence, machine learning, data mining, analytics, statistics, computer science, and operations research, each has its own specific meaning that is different from another. Artificial intelligence is intelligence exhibited by machines and it pertains to the creation of a software system that simulates human intelligence. Machine learning is a science that involves development of self-learning algorithms which can be used to make data-driven predictions in a similar but unfamiliar environment. Popular examples include self-driving cars and web searches. Statistics is a study of collection, organization, analysis, and interpretation of numerical information from data. Data mining is the practice of analyzing data using (machine-learning) algorithms and statistical techniques in order to solve a problem. Computer science covers computational complexity, distributed architectures such as Hadoop, data compression, optimization of data flows, and not to mention computer programming languages (such as R, Python, and Perl). Advanced analytics or Analytics is just a marketing driven terminology that applies many of the data science principles to solve complex problems faced by businesses and society. So while the differences are subtle, each one has its own application in industry and academia. Nevertheless, data science overlaps with computer science, statistics, operations research, and business intelligence in many ways and almost completely encompasses data mining and machine learning.
The subtle differences notwithstanding, data science is an independent discipline which amalgamates statistics, computing skills, and domain knowledge. At the core, data science helps in deriving valuable insights from data. The data science process involves data collection, data pre-processing and cleaning, data modelling and analysis, and insights generation which are applied within a given functional domain to make decisions. Although the process is similar to knowledge discovery and data mining (KDD), a data scientist requires computing skills and domain knowhow to arrive at context-specific decisions. The person working in data science needs to exhibit three distinct skills applied in the different phases of a data science project. As shown in EXHIBIT-A[4], an individual with data science expertise possesses (or needs to possess) a combination of mathematics and statistics knowledge, hacking skills, and substantial domain understanding. The hacking skills include familiarity (but not necessarily proficiency) with software programming but more importantly, a propensity at being able to manipulate any type of data. This is because real-world data hardly exists in a nice tabular format. It[5] is scattered in thousands of text files or on hundreds of web sites or in numerous unstructured excel sheets at best. True data scientists that possess all the three skills are not abundant; because the role entails making sense of amorphous data, deriving bespoke models, and developing algorithms to analyse a complex problem specific within a domain.
Unfortunately, simply churning out numbers or fiddling with inefficient models rarely solves a problem. This is the reason data scientist is one of the most coveted roles in industry today.
Data science is being applied in many industries. Some of the uses in various industries include weather forecasting, intuitive search in online search technology, customer engagement in retail and consumer products and services, fraud detection in banking and credit cards, prediction of sources of energy in Oil and Gas, evidence based medicines in healthcare, and sentiment analysis from social network feeds. Some fields that are routinely implementing analytics services are eCommerce, retail, consumer products and services, financial services, insurance, pharmaceuticals, manufacturing, telecommunications, and high-tech.
HUNTING PEARLY INSIGHTS IN THE OCEAN OF DATA WITH DATA SCIENCE
More and more businesses are embracing data science and analytics in multiple organizational functions. There are mainly three most common ways in which data science is deployed depending on the size of an organization. Large corporations usually deploy their own in-house analytics departments by recruiting data analysts. Business leaders in large corporations typically have humongous quantities of data to sift through in order to make decisions that are important for their business growth. While having an in-house analytics team may not always be an ideal way for institutionalizing data science, even for large corporations, they seem to be driven by large amount of resources at their disposal. Secondly, some companies prefer to buy a COTS (Commercial-Off-The-Shelf) product to cater to some standard requirement. Thirdly, many mid-to-large sized companies prefer to employ customized data science or analytics services to solve their specific data analysis and business operational requirement. This option seems ideal for businesses looking for the flexibility to hire precise services for their bespoke needs.
While the data science projects in most for-profit organizations are getting more and more complex, the fundamental purpose underlying these projects remain the same – to achieve sustainable growth and improve profitability for their businesses. To that effect, the companies put data science into action to gain meaningful insights into their customers, operational processes, supply chain and logistics, product and/or service usage, financial aspects, and future business performance. Conventionally, data science has mostly been applied for market research and market segmentation. However, businesses have a lot more at stake with every business decision as competition has become more and more intense. Gone are the days when business decisions used to be taken on gut-feeling. In today’s globalized world, every major business decision needs to be data-driven. Data science assists organizations and individuals in making fact-based decisions that they can take and defend confidently. That is why it has become essential for organizations, business or otherwise, to deploy data science projects in every division responsible for making any kind of decisions. Some of the types of data science and analytics projects include customer focused analytics through clustering, recommendation engines, root cause analysis, automated rule engines, conjoint analysis to quantify perceived value of features offered, process simulations for operational analysis, predictive modeling for business forecasting, and clustering analysis to identify anomalies, just to name a few.
BENEFITS FROM IMPLEMENTING DATA SCIENCE INITIATIVES
There are some fantastic examples of business organizations gaining huge benefits by systematically and strategically deploying analytics initiatives that involve data science and ethnographic research. Procter & Gamble has institutionalized the data and design thinking approach to such as extent that it is now ingrained into their DNA. The result is that P&G boasts of more than 20 billion-dollar brands in their product kitty. Amazon, a technology company and not just an eRetailer, is really surviving and thriving by understanding customer preferences through the implementation of numerous algorithms. It has helped them to grow quickly from selling just books online in 1996 to target-selling twenty million products in countless other categories. There are many examples of smaller companies that streamlined their processes and implemented analytics based strategies to grow and enter into the big league. Data science initiatives within companies have rendered meaningful insights to drive their firm’s customer experience. These companies have utilized the insights to define their business growth strategies and pursue a culture of data-driven decision making. The benefits include getting pointers to new growth areas, generating ideas to introduce innovative new products, decreasing cost bases and improving productivity to boost profitability, identifying risks of obsolete technologies in their processes, detecting bottlenecks in supply chain, and streamlining inefficient operations.
Even as data science is rapidly changing the business world, it is also spreading its influence on other sectors such as academic research, governments, and social organizations. While the data deluge has increased the complexity for these sectors to analyze the data in a timely manner, it has also opened a plethora of opportunities for them.
Academic institutions in regions such as US, UK, and some countries in Asia are facing sustainability issues due to severe cuts in funding and grants. They are able to apply data science within their own institutional spheres to identify their respective competitive advantage and attract the right students to strengthen their reputation further. Similarly, medical research institutions are now able to work on projects like genome research, DNA sequencing, and stem-cell research for treatment of fatal diseases such as cancer and AIDS. Economists are able to analyze the publicly available data to determine relationships between income levels, education, health, and quality of life.
Governments and public sector organizations are concerned about issues such as monitoring and prevention of terrorist activities, early-detection and control of pandemics, and uniform aid distribution among the poorer countries, which they are able to tackle by sponsoring appropriate data science initiatives.
TACKLING CHALLENGES ALONG THE WAY
Data privacy and security concern has been one of the main reasons keeping some businesses from adopting data science. Moreover companies are facing real challenges in terms of bad quality of data, data inconsistencies, unreliable third party data, and information security. Nonetheless, all roads to meaningful business insights lead through data, whether it is organizational or public. Businesses need to put in place appropriate mechanisms to share data in a controlled manner with analysts and service providers in order to generate hidden insights that can be utilized for business benefits. Data breaches and data thefts remain a valid concern too. Past incidents, albeit few and sporadic, of customer confidential information getting stolen have deterred some from initiating analytics projects. However, business organizations are coming around to the fact that they are fast losing their competitive advantage to rivals due to staying away from analytics. Increasing number of organizations is taking up analytics to secure and grow their businesses as they do not want to be left behind any more. Organizations will increasingly recognize that it is not possible to operate in a 100 percent secured environment. Once organizations acknowledge that, they can begin to apply more-sophisticated risk assessment and mitigation tools. They will look to embed security at multiple levels viz. application-level, execution-level, storage-level, and even contract level. Interestingly, analytics itself is proving to be a great mechanism for security breach prevention.
KEY TRENDS AND THE ROAD AHEAD
In some of the western countries, data science has been thoroughly internalized within large corporations. Even the smaller businesses there employ analytics services to achieve specific business objectives. In India, while the (few) big corporations seem to be deploying such initiatives, most other organizations are still in the nascent stage. One survey of SME business owners cited that most common reasons for the slow pace of embracing [data science] are lack of awareness about the value offered by analytics, dearth of skilled resources, apprehension about technological complexity, cost and ROI concerns, and data security risks.
Notwithstanding the current adoption level, businesses are realizing that they may be taking a big risk not considering data science and analytics as a potent competitive strategy. There is a tremendous rise of personal data originating from social-media, sensor-originated data from wearables, and the Internet of Things (IoT) with the recent surge in the use of smartphones. More and more human actions are generating Exabytes of data today. To get a sense of the amount of data being generated, let’s just say that we will need around 50 billion trees made into paper to print 1 Exabyte of data. That’s roughly 9 huge stacks of papers, each touching Mars from Earth. This enormous amount of data will be of no use if not analyzed and utilized appropriately.
These trends are pushing businesses to re-think their business and growth strategies. There is an increased focus on teaching data science based courses by colleges and universities worldwide. Companies are realizing that the business environment has become uncertain with the fast pace of technological and demographical changes. As a result, many organizations are allocating higher budgets for deploying customized analytics for their businesses to deepen customer understanding, engage customers through multiple channels, identify new sources of revenue, improve productivity and profitability, streamline business processes, and build competitive advantage. Going forward, use of customized analytics will become pervasive. More and more organizations will develop their unique value propositions around the valuable insights they gain about their existing and prospective customers.
Implementing data science initiatives to build competitive advantage is a matter of leading and not following the pack. In an industry competing for the finite market share, early-adopters of data science best practices will be the eventual winners.
[5] ‘It’ refers to ‘the data’. In the modern world, the term ‘data’ is used in both singular and plural sense as per the context. Technically speaking, singular of data is datum.
“This article reposted here was originally published as the cover story in the July-2015 edition of Computer Society of India – Communications magazine. You can also read this article at its source at http://www.csi-india.org (Link path: http://www.csi-india.org->PUBLICATIONS->CSI Communications->CSIC 2015->CSIC 2015(July)).”
You can also subscribe to our blog –Our Perspectives– to receive interesting articles and tips in email. We would love to read your perspectives and comments on that.
L ast Friday, I was having a very productive give-and-take with a group of business people on the benefits of business analytics. During our conversation, I had an interesting observation about what those people considered the most important thing in analytics. They seemed to think that data is the most important element in any (business) analytics project. I am sharing here the gist of that conversation. Hope you too find it interesting.
I believe data is the second most important thing in analytics or data science.
The most important thing in analytics is ‘the question to be answered’.
Let me explain why.
Typically analytics initiatives are undertaken to achieve one of these four objectives:
1. To solve a problem
2. To accomplish a specific (business or non-business) goal
3. To prove or disprove a hypothesis
4. To answer a question
Unless you have a specific question that needs answered, any analytics initiative will at best be a random analytical study with no direction. The specific question or the problem statement gives it a definite goal. More importantly, the goal will determine what data to use to arrive at a fact-based conclusion.
I like to think of it as ‘a ship sailing in an ocean’ analogy. An analytics initiative making way through the huge organizational data is analogous to a ship sailing in an ocean. If the ship has a pre-determined destination, then it takes the intended route to reach that destination and achieves its objective. To a bystander, mere existence of a ship creates a perception that it is going somewhere. However, if the destination is not clearly defined, the ship might just have a fun time cruising the ocean and figuring out what the ocean has to show. Worse, it might just flounder in the huge ocean and may not reach any meaningful place.
A ship like that is like a holiday-cruise-liner – expensive to sail but not tasked with any objective to reach a place.
Likewise, many organizations launch their analytics initiatives without any specific target. They just start with a tentative goal of let’s figure out what the data shows along the way. In the absence of any pointed objective to pursue, the analysts running the initiative either have great fun cruising with unbounded data or they just lose their way in it. Such an initiative renders no meaningful results.
An analytics initiative like that ends up becoming an expensive proposition like a luxury cruise-liner.
That’s why the most important thing in analytics is the question to be answered. The question determines what data to use to reach a definitive answer.
For example, to determine an organization’s target customer profile and their buying habits, the customer data will need to be analysed. Similarly, the sales history data will be required to ascertain a company’s sales trends.
The data serves as the route to finding the answer to the question.
The data to be analysed will change with the question to be answered. In our analogy, it is the route taken by the ship to its destination. Different destinations will warrant different routes to be pursued.
The selection of the right data becomes important after determining the objective(s) of the analytics initiative. The right prioritization will not only help you reach your destination faster, but it will also be very cost-effective as you save yourself from expending time, money, and manpower in analysing needless data.
In a nutshell, make sure that you do not end up getting lost in the ocean of data with wrong prioritization. Data-cruising is an expensive way to have fun at the expense of an organization’s usually scarce resources.
You can also subscribe to our blog – Our Perspectives – to receive interesting articles and tips in email. We would love to read your perspectives and comments on that.
2 015 arrives on a promising note for analytics – both as a technology and as an industry. 2014 proved favorable for analytics in getting wider acknowledgement as a serious strategy to adopt for long term competitive advantage. In that sense, 2014 was the year of acceptance and 2015 augurs to be the year of growth.
In this paper, we take note of the emerging trends in analytics with a pointed focus on their applicability to SME businesses. We began by collecting the trends data released by leading publishers. Our analysis of the aggregated information revealed some interesting bytes about the direction of these trends. Here we share with you our own perspectives on the top trends predicted by the external industry experts.
SMEs embrace analytics to deepen customer understanding.
More businesses are starting to anticipate their customers’ needs and act on it proactively. Personalization is the key. New technological advancement is making it possible to allow metrics to be tracked across even more areas for each customer, thus enabling SMEs to understand their profitable customers like never before. More screen time per consumer is creating even more data to be analysed and mined for deeper insights. Smart SME businesses looking for growth and customer loyalty are going all out to invest in cost-effective analytics solutions to get closer to their customers, drive cost efficiencies, and improve their product and service offerings. Larger organizations are implementing it to improve their customer service and call centre processes. B2C businesses like the consumer product, retail, and wholesale companies predict the fastest growth in the use of analytics to help improve customer insights and meet real-time customer demands. SMEs are implementing analytics to transform their marketing approach to connect with more prospects and customers, to provide them with the right information at the right time in their buying journey, and to create favourable perceptions about their offerings. After all Marketing is a battle of perceptions, not products.
Use of customized analytics becomes pervasive.
More and more human actions are generating Exabytes of data today. To get a sense of the amount of data, let’s just say that we will need around 50 billion trees made into paper to print 1 Exabyte of data. That’s roughly 9 huge stacks of papers, each touching Mars from Earth. So we now have developed massive capability of data generation; and the rate is only increasing with the advent of wearables, smart machines, and the ‘Internet of Things’. But this enormous amount of data will be of no use if not analysed and utilized appropriately. Anytime anywhere analytics will be the only way forward to satisfy the pressing need to analyse this vast pools of structured and unstructured data inside and outside the enterprise. Data analytics will soon become so ubiquitous that it will be deeply and invisibly embedded everywhere.
For SMEs looking to break away, micro-segmentation and micromarketing at the consumer level can provide a big competitive advantage. You can’t compete, if you don’t have competitive advantage. Information week survey reveals that there is fall in the trend to standardize analytics. For SMEs, this means they are not seeing competitive advantage in standardized analytics products. Instead, more companies are now hiring customized analytics to satisfy their unique needs. SMEs across all industries cited ‘ensuring information accuracy and reliability’ as a top concern. 2015 is likely to see a democratization of data throughout the organization, meaning that more departments will become adept at using the insights generated by experts. Day-to-day activities will be based on data and the insights created from it.
Rise of sensor-originated data from wearables and the ‘Internet of things’.
Wiki defines the Internet of Things (or IoT) as the interconnection of uniquely identifiable embedded computing devices within the existing Internet infrastructure. For example, your smart watch continuously measuring your pulse while you are running, and prompting you to stop when it senses that your pulse is beating abnormally. The ‘internet of things’ has facilitated the innovation of wearables that can capture data using sensors and communicate it instantly over the internet. A few examples of wearables are fitness trackers, heart rate monitors, and smart watches. These wearables and IoTs will empower humans to take predictive (not just proactive) actions in a timely manner. The sensor based data collection will further boost application of analytics to analyse all these data. However, in the context of wearables and IoT, we are still in the stage of figuring out its possible real-life applications to individuals and businesses. In 2015, the IoT is expected to venture beyond wearables into your homes and surroundings.
Cloud becomes main-stream with greater cloud-based ecosystem.
Cloud has already crossed the stage that IoT is currently in. It has made deep inroads into datacentres, data warehouses, centralized storages, and servers. The cloud ecosystem is likely to penetrate further with the growth of centrally coordinated applications being hosted on cloud infrastructures around the world. 2015 will see horizontal spread of cloud-usage in device convergence and application portability across devices. Strictly focusing on SMEs, companies like Amazon and Google have rapidly matured their cloud-based offerings to SMEs with freemium and usage based models. However, monetization models of cloud based services remain complex. Despite that, cloud adoption is likely to increase among larger businesses as they strive to contain their infrastructure costs. Whereas the smaller businesses will (and probably should) expect the cloud-offerings to improve in terms of security, pricing-models, understanding of its benefits, and real ROI, before jumping the cloud bandwagon.
Better acceptance of open source technology like Hadoop and NoSQL databases.
If there is one trend which has high standard deviation with its long term sustainability, we believe it is this one. Hadoop is becoming popular because of “its ability to store and process semi-structured, unstructured, and variable data”. With the burgeoning unstructured data (from social media), it is no surprise that Hadoop is getting good acceptance among (larger) customers. But we hasten to add that Hadoop and NoSQL may not be in the priority list of most SMEs, simply because SMEs, unlike larger companies, have a tight purse to operate. They already have other higher priority strategies to undertake leaving not much scope for investment in the likes of Hadoop. It would be interesting to monitor and track how this trend pans out in the months to come.
SMEs will incorporate mobile-based solutions in their IT strategy.
A mobile phone is nothing short of a computer these days. Every passing month, millions of consumers are switching to a smart phone and relying on it for their daily chores. Referring a to-do list, searching for a Thai restaurant in the vicinity, buying books or fashion garments, downloading songs, and pretty much every other activity is increasingly shifting to a mobile device. Companies are also reinforcing their online presence with mobile-based solutions. The sale of phablets is likely to grow to 60%; thus SMEs will find it prudent to be in tune with this trend in order to be able to tap tech-savvy consumers.
Optimizing business gains from social media presence.
Businesses see social media as a mechanism to attract more customers, create buzz about their products and services, seek feedback to better customer service, and improve service offerings. Many SMEs seem to employ social media in a disorganized manner rather than design a systematic campaign to deploy a social media strategy for say, digital marketing. They hope that it will help them in some way. Hope is rarely a good strategy. In the coming year, SMEs are likely to rely on social media rather than just use it. However they seem to lack the means or resources to measure the gains from their social media strategy. This is where professional services firms can assist in devising a well-planned strategy to leverage real gains from social media.
Integration woes.
Frankly, we are as surprised (or unsurprised) to see integration woes as an ongoing trend as you possibly are. If there is one trend that has continued over decades, it is this one. Over the years, the ‘entities’ to be integrated have changed but the integration-related troubles continue. In the 1980s and 1990s, integration of legacy systems with open systems gave pain. In the 2000s, integration of different software architectures was cause for grief. Today, analytics tools and techniques are being developed around the Internet of Things, but the integration of these systems is lagging. More specifically for SMEs wanting to embrace analytics, integration of structured, semi-structured, and unstructured data is a source of much anguish. Worse, they typically lack the expertise and resources to manage the entire integration process despite employing a team of analysts. This is another reason that in-house analytics teams are increasingly not being preferred because of the need of specialist treatments of data.
Data security and privacy concerns.
Data privacy and security concern has been one of the main reasons keeping SMEs from adopting analytics. All roads to meaningful business insights lead through your data. You need to share data with analysts and service providers in order to get hidden insights that can be utilized for business benefits. However, SMEs have been wary in sharing their data, probably rightly so, in order to protect their customer identities, even at the cost of losing their competitive advantage to rivals. But now, with increasing number of SMEs taking up analytics to secure and grow their businesses, others don’t want to be left behind. Organizations will increasingly recognize that it is not possible to operate in a 100 percent secured environment. Once organizations acknowledge that, they can begin to apply more-sophisticated risk assessment and mitigation tools. They will look to embed security at multiple levels viz. application-level, execution-level, storage-level, and even contract-level. Interestingly, analytics itself is proving to be a great mechanism for security breach prevention.
Organizations moving away from in-house analytics.
Organizations hired staff to set-up their own in-house analytics teams primarily for two reasons: First, they intended to take up analytics as an ongoing business strategy and thought that hiring in-house analysts was the inexpensive way to achieving that objective. Second, they were guarded about sharing data with external service providers. The arrangement of in-house analytics department should have worked had it consisted of the right skilled-resources, such as data scientists and analytics experts, who came from analytics background. In many cases, these data analysts might have delivered some initial benefits despite coming from the business-side. However, companies seem to have realized that they are spending way too high to achieve that purpose. Not only do they not have the ‘right-skilled’ resources to take up the ongoing analytics challenges, but it also takes their focus away from their core business. Moreover, setting up an in-house analytics team is a costly and risky proposition requiring the necessary infrastructure to operate. Therefore, SMEs seem to be moving away from heavy in-house big data infrastructure to external analytics service providers. In some cases, they are even going for big data-as-a-service in the cloud. This allows them to have a lean in-house analytics team of just analytics officers or data officers and get their stuff done through the external knowledge workers.
In sum, most trends are pointing toward ‘ubiquity of analytics in business’. Which of these trends will realize in a big way in 2015? Our guess is as good as yours! Meanwhile, we would love to know your thoughts on how analytics has contributed to your business in 2014, and more importantly how do you perceive it to perform this year. Please do share!
You can also subscribe to our blog – Our Perspectives – to receive interesting articles and tips in email. We would love to read your perspectives and comments on that.
A s a CxO considering analytics solutions for your organization, whether to buy or build is invariably the first perplexing question you will face. There are many reports out there that evaluate these options and propose one of them.
For a business, it is of paramount importance to get a system designed and developed that meets the organization’s strategic goals. On the Buy↔Build spectrum, ‘buying a solution and twisting it to force a fit with your requirements’ is rarely an ideal way for most clients to meet their real requirements. On the other hand, it is often costly to ‘build your own thing’ in terms of time, money, and effort.
We would like to look at the buy-or-build decision from a broader perspective.
We believe that this decision depends upon two main questions:
1. Who is making the decision? The size and type of organization making the decision.
2. What is their purpose? The benefits for which the organization is making the decision.
The business needs of a multinational corporation are vastly different from those of a small and medium enterprise (SME) or those of a neighbourhood store. Moreover, the purpose for which such a solution is required by these businesses is also very different. While a large corporation may be willing to invest huge amounts of resources in such an initiative to seek strategic benefits, an SME might just want to implement it as a one-time project with tactical benefits in mind. In short, it depends on what job each business wants to get done. Therefore, we have identified a third option, which is becoming more popular, to acknowledge the real needs that most corporations have but tend to think only in terms of ‘Buy’ or ‘Build’. We call it the ‘Get-the-job-done’ option. So before we delve deeper into the details of buy, get-the-job-done, and build, let us start on the same page in terms of what each of these decisions mean:
A] The ‘BUY’ decision: Buying a product off-the-shelf or buying a license to use a product with little or no customization. In general, the product is licensed by the vendor or a subscription-fee is charged for its recurrent usage.
B] The ‘BUILD’ decision: Setting up an in-house team of technically skilled resources to develop a product yourself from scratch. This decision entails upfront investment in terms of recruiting the right-skilled resources, training them, deploying the necessary technical infrastructure, and having an overhead team of managers to supervise the development efforts to ensure that the product is developed as envisaged.
C] The ‘GET-THE-JOB-DONE’ decision: This decision involves hiring an analytics services provider to achieve your specific requirements, be it strategic or tactical. Such initiatives usually begin as a tactical project but go on to become strategic in nature once the initial results are visible.
In order to make this decision, you need to evaluate your requirements on the following five mutually exclusive but collectively exhaustive parameters:
a. Scale of operations
b. Benefits sought
c. Total cost of ownership (TCO)
d. Availability of resources – skilled people, time, infrastructure
e. Risk tolerance
So let us look at each option in detail.
A] When and why should you consider the BUY decision?
The BUY option should be pursued whenever the focus is on acquiring a product with standard specifications, quickly.
a. Scale of operation is very small. For a small business operating in a neighbourhood, the requirements are usually generic. If you are running a corner-shop, like a coffee shop or a sandwich-bar, some standard products are generally available. These ready-made solutions address most of your broad requirements. Level of customization sought is low. So you can run your business effectively with least modifications in a standard product as it matches most of your needs. Your customization requirements are not high enough to warrant investment for a customized product.
b. Benefits expected are generally (but not necessarily) tactical in nature. A small business, like a fashion accessories corner-shop, is generally looking for a quick turnaround of inventory or brisk sales during festival season. As time is of essence, you do not have the luxury to build a custom solution. In such cases, you should go for a ready-made product.
c. Lack of skilled technical resources may be the key factor in deciding against going for a custom solution.
d. Micro businesses typically have budget constraints. As a result, it is not economically feasible for you to build a proprietary solution. You may find it more logical to buy a cheaper commercial off the shelf (COTS) product instead.
e. Risk tolerance is not high. A couple of wrong decisions might result in big setbacks to a micro-business hence it is always prudent to go for a well-proven solution that does not cost a lot of money.
B] When and why should you consider the BUILD decision?
The BUILD option should be pursued whenever the focus is on addressing the strategic objectives of the large organization and cost is not the immediate concern.
a. Scale of operations is enormous. A multinational corporation with global operations, like a financial institution or a telecom company, generally has numerous product lines targeting multicultural consumers worldwide. These businesses require a solution that has functionalities appropriate to satisfy the disparate needs of their diverse customer segments. So a high level of customization is required by large corporations. COTS products with standard specifications are rigid to modifications and cannot meet these specialized needs. Hence a proprietary solution may be better equipped to address your business scalability concerns.
b. Benefits expected are predictably strategic in nature. As a CEO of a large corporation, like a multinational retail chain or a consumer products company, you are constantly looking for distinct competitive advantage to outperform your rival(s). To gain that edge, you cannot rely on the same off-the-shelf product bought by your competitors; you need an analytical solution that is tailor-made to optimize your business specific processes and operations. Devising your own customized system is likely to give you the competitive advantage in the long run.
c. Availability of resources – people, infrastructure, and time – is pivotal to building a truly productive solution. You must recruit right-skilled people viz. data scientists, analysts, and analytics experts, and train them to form a cohesive team. This team will have to be deftly led by able managers in order to build great analytical systems and tools, in a timely manner. In today’s fast changing world, the development team will have to be agile in incorporating changes in the system to keep with the technological pace in order to outplay the competitors.
d. Total cost of ownership (TCO) in case of custom-built solution is typically high. A large organization going for the build option will need to invest heavily in order to extract the strategic benefits to the fullest. These big companies are able to do so thanks to their deep pockets. That’s why the in-house ‘build’ option is suitable primarily for the large corporations.
e. There is a discreet risk involved in heavy upfront investment. Large corporations deploy an in-house team of developers expecting large gains at a later date. However, many things can go wrong, say, the technology may itself become obsolete, or the actual gains may not be worth the time and efforts. Moreover, in-house analytics team may distract the company away from its focus on the core business. Nevertheless, large cash-rich corporations acknowledge these risks and have a high tolerance to bear them.
C] When should you decide to just GET THE JOB DONE?
This option is fast emerging as the preferred alternative among SMEs and even some large organizations as it takes away the complexity and enables you to compete on analytics in a cost effective way. You should decide to hire analytics service provider whenever the focus of your organization is on getting results – cost-effectively and with lower risk.
a. Size of operation varies between a micro-scale and a global business; small and medium sized enterprises (SME) fall in this category. For an SME operating at a regional or a national level, the business needs vary tremendously because the target customer segments differ a lot. An off-the-shelf product that is rigid to modifications is invariably unsuitable for your needs. A ready-made product only means you have to forcefully fit your requirements to the features provided by it. Hence buying an off-the-shelf product is not a sensible approach because you do not want to end up paying your hard earned money for features your business does not want. If you are running a small or medium sized enterprise, like a retail furniture store, a retail consumer goods shop, or a B2C services company, level of customization required by your business is quite high. You need a solution that is flexible to frequent changes. Therefore, an analytics partner is ideal for you to help meet your true needs.
b. Benefits are expected quickly and in a cost-effective manner as the focus is to win quick results. As a business leader running an SME, you want to keep your focus on your core business. You really need a partner that provides flexibility, gives option to customize your requirements, and works for your success while ensuring good customer service.
c. Total cost of ownership (TCO) is comparatively low if you are employing an analytics service provider. They will offer customer service in deploying the solution and training your staff, so you save on the maintenance and training costs otherwise incurred in case of buying or building a product. That’s how the get-the-job-done option reduces your total cost of ownership.
d. Resource requirement is minimal for you if you go for analytics services partner. If you do not have a team of skilled resources to develop your own analytics solution, then it would be a wise decision to hire an analytics partner who will have expertise to productively work towards achieving your business objectives.
e. You can choose to share the risk with your analytics partner by opting to outsource your organization’s analytics activities. The get-the-job-done decision is attractive for its feature of sharing the risk between the business and the analytics partner.
Having said thus, it is not written in stone that an SME cannot build its own custom solution or a micro-business cannot opt for analytics services option. There are no stringent rules as such. The following table only illustrates a one-glance view of the merits and demerits of each of these options for most cases. In a nutshell, the decision of whether to buy or build or get the job done depends on your specific requirements and your preference for each of these options.
You can also subscribe to our blog – Our Perspectives – to receive interesting articles and tips in email. We would love to read your perspectives and comments on that.
Schedule Your Complimentary Session with us Today!
We promise you will come away with insights on utilizing your business data productively and cost-effectively. This session will be free of charge and there is no obligation.