Customer Segmentation

Business Decision

Fields Medal, Open Problem, and Business Decisions

Veravizion No Comments

Earlier, we discussed how analytics with statistics is valuable and beneficial in making business decisions and formulating strategies.

There appears an increasing level of interest among math scientists to work on topics, like machine learning, that are changing people’s lives through its application in business.


“A topic that is attracting more and more attention is mathematical aspects of machine learning. There are many directions; one that interests me is how I could use some of these exciting new tools in my own research. Another very ambitious and noble goal is to create a mathematical theory of machine learning. When does it fail, and when we can we hope for good results?”

— Maryna Viazovska, 2022 Fields Medal winner, in a Q&A with Nature

This Veracle is about how the mathematicians’ work is instrumental in pushing the boundaries of making data-driven decisions in business.

Let us begin with a little fun challenge: Take a look at the four knights on the cover picture. Can you exchange the positions of the black and white knights on the given chess board?

If you can, then you may have it in you to win the Fields medal.

What is Fields Medal and how is it relevant to business?

The Fields Medal is the most* prestigious award a mathematician can receive. The International Mathematical Union presents the medal to young math scientists for outstanding contributions in mathematics. The Fields Medal is only awarded every four years.

Business Decisions
The obverse and reverse of the Fields Medal

This year, four mathematicians are the winners of the Fields Medal. They received their awards earlier this month in Helsinki, Finland.

Business Decisions
2022 Fields Medal winners

They have earned this distinguished honour for solving or moving closer to solving longstanding “open problems.”

An open problem is a known stated problem which has not yet been solved. It is assumed to have an objective and verifiable solution.

The answers to open problems pave ways for innovative ideas and possibilities. In business context, these answers facilitate, among other things, making business decisions better and faster.

How is their work exciting and significant?

Business decision making has become too complex. Business executives must consider both qualitative and quantitative information to make decisions.

Qualitative information uses subjective judgements. This includes non-quantifiable data such as employee expertise, people attitude towards change, and company culture among other intangible aspects.

However, quantitative information uses data. Now, organisations have too much data available to them. They have data generated by operational transactions, market research, and external sources. Organisations must analyse this exponentially growing data to make decisions. Moreover, they must make many of these decisions in the runtime.

To that end, businesses need more advanced computational algorithms to sift through zettabytes of data to analyse and arrive at useful insights. The conventional techniques are highly time and cost intensive.

This is where work of the Fields Medallists becomes significant.

How does mathematics help business decisions?

This year’s Field Medallists’ works are centred on number theory, probabilistic theory, and combinatorics, among other more intricate topics.

Here are a few examples of business applications of the topics of their work.

Number theory deals with the properties and relationships of numbers.

It has helped in public key cryptography, such as RSA algorithm. This has enabled confidential communications, digital signatures, and secure online transactions for e-commerce companies.

Probability theory is the branch of math concerned with calculating the likelihood of an event. It has numerous applications in business.

From all kinds of risk assessment and modelling (like that for investment and insurance) to sales forecasting, most prediction algorithms use probability theory.

Combinatorics is the study of objects and connections between them. Simply speaking, it has applications wherever we need to arrange things using permutations and combinations.

One can see examples of combinatorics everywhere. It can help in optimising communication networks and logistics. Combinatorics had a crucial role in manufacturing. For example, modular toy manufacturing.

How does it matter to Veravizion?

At Veravizion, we help our clients thoroughly understand their customers. The objective is to devise and implement effective marketing strategies for their business growth.

This involves figuring out our customers’ real target customers, understanding their purchase motivations, performing causal analysis, optimising resource allocations, and in general solving their business problems.

In this process, we apply several techniques such as clustering, regression, optimisation, resource planning, and various other statistical analyses. These are based on pure math and statistical concepts like probability theory, combinatorics, and mathematical optimisation.

Are there any areas of business where you think we can consider using math and statistics?

How else does math help businesses?

* The Abel Prize is also regarded as a top award in mathematics. According to the annual Academic Excellence Survey by ARWU, the Fields Medal is consistently regarded as the top award in the field of mathematics worldwide, and in another survey conducted by IREG in 2013–14, the Fields Medal came closely after the Abel Prize as the second most prestigious international award in mathematics.

Related Posts:

<– Is analytics all hype and no substance?

Want to succeed in your venture? Don’t start with planning –>

Cover Photo courtesy: https://en.chessbase.com

If you liked reading this article, then please subscribe to our blog – Veracles. That way, you can receive interesting insights in email.

Also, please do follow Veravizion on LinkedInTwitter or Facebook to receive easy updates.

E-Retail KPIs

How E-Retail KPIs different from traditional Retail KPIs?

Veravizion No Comments

How are E-Retail KPIs different from traditional Retail KPIs?

What is E-Retail KPI?

E-retail is the online website of a retail store. KPI means Key Performance Indicators. So, the key performance indicators for an online website of a retail store are e-retail KPIs.

Traditional retail is a physical brick-and-mortar retail store. Let’s call their KPIs, traditional retail KPIs.

E-retail and traditional retail by their nature are different. The difference exists from two perspectives: the customer perspective and the retailer perspective.

Let us see the customer’s perspective first.

The customer perspective drives their shopping preferences and buying behaviour. For instance, customers who value convenience, price comparison, time-saving, and the ability to shop 24×7 prefer to shop online. Whereas, customers who want to touch, feel, and try the product first tend to shop in physical stores.

Increasingly, customers are buying in an Omnichannel environment. Omnichannel means all channels work seamlessly as one. That is, they discover a product in one channel, check it out in another one, and buy through a third. Such as shown in the figure below.

E-Retail KPIs
Omnichannel shopping is becoming the norm

Now, the retailer perspective.

The retailer’s perspective influences their business operating behaviour. Traditional retailers focus on maximizing the in-store experience for their customers while optimizing store space. While e-retailers focus on the online shopping experience and user personalization.

These two perspectives influence their KPIs.

How E-Retail KPIs Differ?

Many e-retail KPIs are common with traditional KPIs. Some of these are the various financial ratios, customer retention, and conversion rate. However, e-retail KPIs are different from traditional retail KPIs in two major areas:

  1. Customer Acquisition Channels
  2. Customer Shopping Behaviour

Let us see how.

Customer Acquisition Channels

This is the source of customer traffic to your business. Understanding where your customers are coming from is extremely important for business growth.

E-retail channels are primarily organic search, direct search, referral, e-mails, and social media. These channels actually lead customers to e-retail stores (i.e. the website). So, e-retailers can easily measure the percent of customers acquired from these channels. They can then devise their deliberate strategy around these insights.

For example, Facebook generates 13.9% of e-retail website traffic, but actual sale happens in only 4.7% of cases. This is a critical piece of information in two ways: First, it allows you to allocate resources efficiently. Also, it improves ROI.

Traditional retail channels are different.

They are mainly word of mouth or advertisements in print, television, radio, and social media. For traditional retailers, it is nearly impossible to accurately calculate the percent of customers acquired from these different channels. This is because these channels do not ‘redirect’ them to the store.

For example, a customer actually visiting a store may have seen an ad or may have been referred by word of mouth. But, they may not even remember this information when they visit the store.

Customer Shopping Behaviour

Customer behaviour varies a lot between in-store purchases and online purchases. Understanding customer behaviour is central to acquiring more customers.

In e-retail, KPIs like Shopping Cart Abandonment (SCA) and Customer Lifetime Value (CLV) are important and helpful. The analysis of the shopping cart abandonment rate and the list of discarded items can help improve our understanding of the purchase intent of customers. Similarly, understanding a customer’s lifetime value helps in targeting profitable customers more effectively.

Whereas for traditional retail, understanding shopping behaviour for every customer is tricky and costly. We can only perform market basket analysis. This will only analyze the products added together in the cart. But there is no definite way to measure discarded items from carts in the physical stores. Moreover, physical space-oriented KPIs like sales per square foot are not relevant to e-retail.  

In a nutshell, it is essential for retailers to rethink the right KPIs while taking the retail business online. This is especially true since omnichannel shopping is becoming the norm.

Related Posts:

<– Are you survival-oriented or a growth-oriented executive?

Know customer shopping behaviour KPIs in e-retail? –>

Author: Sumit Patil

You can also subscribe to our blog – Veracles – to receive interesting articles and insights in email. We would love to read your perspectives and comments on that.

Do follow Veravizion on LinkedInTwitter or Facebook to receive easy updates.

Cover Photo courtesy: Blue Planet Studio

achieve strategic transformation for enduring growth

How do you achieve strategic transformation for enduring growth of your company? – Part-II

Veravizion No Comments

Thanks for your overwhelming response to the ‘achieve strategic transformation for enduring growth – part-I‘ of this two-part series. In the part-I of this article, we agreed with Mark that strategic transformation is indeed the key to enduring growth. However, we differed on the way to achieve transformation.

So how do you achieve strategic transformation for enduring growth of your business?

In part-I, we asserted that the secret to achieving strategic transformation is to be fiercely customer-centric.

In this part, let us discuss how you can transform your business and grow it further keeping customer-centricity at the core of your business strategy.

When you become passionately customer-centric, you make your customers’ delight the overarching goal of your organization. ‘Customer delight’ becomes the Shinbashira – the central pillar – on which your organization stands. You listen to your customers and place your customers (and consumers) at the centre of everything you offer. You direct your resources toward satisfying (and exceeding) the needs and wants of your consumers. As their needs change, the solution you offer changes, and the business strategy behind delivering those solutions changes too. You become so agile in responding to your customer’s changing tastes that you barely notice the incremental changes taking place in your organization. This continuous change becomes second nature to your organization.

And when you look back over a period of time, you realize that you have moved so significantly from your original business situation that there is hardly anything common between the old face and the new face of your organization. It is like the organization undergoing morphing.

This is when you have achieved transformation, without consciously embarking on doing that.

You don’t TAKE disruptive actions for strategic transformation; you take well-conceived actions with specific goals that BRING ABOUT ‘disruptive transformation’. There is a difference!

But this is a very simplified view of an organization going through transformation.

What actually happens (or has to happen) on ground is far more complex and far too deliberate.

Let us see how.

Our analysis of the top-100 brands revealed that when organizations commit themselves to becoming customer-centric, they tend to take these five steps so as to focus on creating maximum value for their customers:

  • They meticulously track usage of their products and services to figure out their customer’s usage patterns. This may involve analysing usage data from customers and in some cases their customer’s customers, who are using products that incorporate your product.
  • They strive to understand their customers thoroughly to comprehend the real reasons behind their customers’ purchases and apply that knowhow to identify real profitable customers. They perform detailed analysis of the customers’ data to generate deep insights into their purchasing behaviour and to spot any changes in them.
  • They incorporate their customers’ feedback into R&D to continually improve their products and services in line with the changing consumer expectations. Once in a while, this may result in conceptualizing an innovative product not yet in the market.
  • They put in place mechanisms to refine their operational strategies and organizational processes to address the changing priorities.
  • Most importantly, they use the feedback to calibrate their future roadmap and formulate the long-term growth strategy for their business.

These actions, when deployed effectively, enable these companies to embrace one or more of the three growth strategies: Market Expansion, Product/Industry Expansion, and Operational Improvement.

Let us briefly look at each of them.

1. MARKET EXPANSION – Business growth by entering into new market(s):

When you are customer-centric, you strive to know the face of your most profitable customers and the benefits for which they are buying from you. Your growth objective is to identify more of such customers globally who may benefit from your offering. This insight assists you to explore new customer bases in newer markets. The way this objective is achieved varies from company to company. Some companies merge with or acquire other businesses having presence in the target market, and leverage that presence to market their products. Others may form joint-ventures on the agreement to share technology and markets. Yet others may plan to grow organically by entering a new market on their own.

Coca-Cola, MTV, Starbucks, Nestlé, Heineken, and scores of other companies have successfully located their target customer segments across the world. They achieved international expansion over an extended period of time transforming their businesses from being local entities to becoming global market-leaders.

2. PRODUCT OR INDUSTRY EXPANSION – Business growth by introducing better products and services:

As your customers’ preferences change, the products or services they employ to do their job (need to) change too. When you are constantly tracking this change, you get innovative ideas for improving your existing product lines and introducing new ones. A good grasp on customers’ needs in new areas can propel you to launch new product categories that didn’t exist previously.

Procter & Gamble has developed this expertise in consumer research through ethnographic methods; they claim to co-create new products or new line of existing products by closely observing how their consumers use the existing products.

Amazon is an excellent example of growth through product or category expansion. Pursuing the vision of becoming ‘earth’s most customer-centric company’, Amazon is single-mindedly striving to make customer’s (online) shopping experience easy, comfortable, and pleasant. In fact, they are in the process of disrupting the entire book publishing industry by planning to publish and sell every future book online. The established book-publishers lost touch with the changing consumer need of ‘reading books anytime-anywhere without having to spend time buying it physically’, and now their survival itself is threatened by the digital publishing industry; whereas the likes of Amazon, with relentless focus on the consumers, are thriving.

3. OPERATIONAL IMPROVEMENT – Growth by developing unique competitive advantage:

This strategy involves creating differentiation in your business model and/or operations. Companies are leveraging their organizational data by applying the latest analytics techniques to mine insights. These insights are utilized to devise new distribution channels, optimize logistics and supply chain management, improve operations by deploying superior technology, and streamline existing processes. Relentlessly pursuing these strategies eventually renders them distinctive advantage over their competition, and helps them grow in the marketplace.

FedEx addressed the customer need of next-day courier deliveries and launched ‘FedEx Express’.

eBay provided easy B2C and C2C sales services to consumers via its (online) eCommerce platform.

Michael Dell grew his company by sensing an opportunity among PC-savvy consumers who enjoyed the convenience of customizing their PC and buying it online to be delivered in days. Thus Dell has developed an innovative business model of ordering PC online which enabled them to lower their PC prices to impossibly low levels.

These strategies have the potential to propel your organization into a bigger growth curve.

And the key to doing this is to understand your customers as thoroughly as you can!

In this world of disruptive innovations, business owners and CEOs must focus all their efforts in deeply understanding their customers. When you become ardently customer-centric, you set yourself up for strategic transformation that is key to enduring growth of your business.

Related Posts:

<– Strategic Transformation Part-1

3 Lessons Every Executive must Learn from Wimbledon Centre Court –>

You can also subscribe to our blog – Our Perspectives – to receive interesting articles and tips in email. We would love to read your perspectives and comments on that.

Do follow Veravizion on LinkedIn, Twitter, Facebook, or Google+ to receive easy updates.

2015 analytics trends - a rising trend pic

2015 Analytics Trends for SME businesses

Veravizion No Comments

2  015 arrives on a promising note for analytics – both as a technology and as an industry. 2014 proved favorable for analytics in getting wider acknowledgement as a serious strategy to adopt for long term competitive advantage. In that sense, 2014 was the year of acceptance and 2015 augurs to be the year of growth.

In this paper, we take note of the emerging trends in analytics with a pointed focus on their applicability to SME businesses. We began by collecting the trends data released by leading publishers. Our analysis of the aggregated information revealed some interesting bytes about the direction of these trends. Here we share with you our own perspectives on the top trends predicted by the external industry experts.

SMEs embrace analytics to deepen customer understanding.

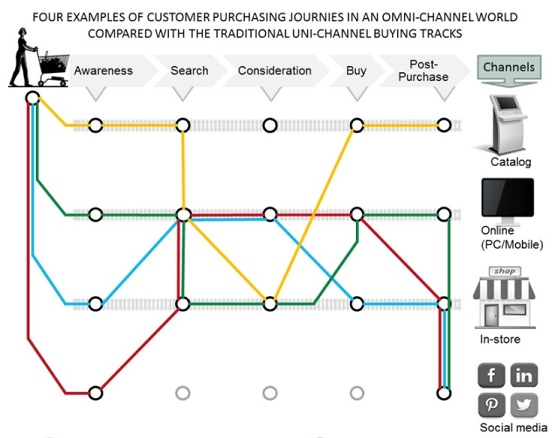
More businesses are starting to anticipate their customers’ needs and act on it proactively. Personalization is the key. New technological advancement is making it possible to allow metrics to be tracked across even more areas for each customer, thus enabling SMEs to understand their profitable customers like never before. More screen time per consumer is creating even more data to be analysed and mined for deeper insights. Smart SME businesses looking for growth and customer loyalty are going all out to invest in cost-effective analytics solutions to get closer to their customers, drive cost efficiencies, and improve their product and service offerings. Larger organizations are implementing it to improve their customer service and call centre processes. B2C businesses like the consumer product, retail, and wholesale companies predict the fastest growth in the use of analytics to help improve customer insights and meet real-time customer demands. SMEs are implementing analytics to transform their marketing approach to connect with more prospects and customers, to provide them with the right information at the right time in their buying journey, and to create favourable perceptions about their offerings. After all Marketing is a battle of perceptions, not products.

Use of customized analytics becomes pervasive.

More and more human actions are generating Exabytes of data today. To get a sense of the amount of data, let’s just say that we will need around 50 billion trees made into paper to print 1 Exabyte of data. That’s roughly 9 huge stacks of papers, each touching Mars from Earth. So we now have developed massive capability of data generation; and the rate is only increasing with the advent of wearables, smart machines, and the ‘Internet of Things’. But this enormous amount of data will be of no use if not analysed and utilized appropriately. Anytime anywhere analytics will be the only way forward to satisfy the pressing need to analyse this vast pools of structured and unstructured data inside and outside the enterprise. Data analytics will soon become so ubiquitous that it will be deeply and invisibly embedded everywhere.
For SMEs looking to break away, micro-segmentation and micromarketing at the consumer level can provide a big competitive advantage. You can’t compete, if you don’t have competitive advantage. Information week survey reveals that there is fall in the trend to standardize analytics. For SMEs, this means they are not seeing competitive advantage in standardized analytics products. Instead, more companies are now hiring customized analytics to satisfy their unique needs. SMEs across all industries cited ‘ensuring information accuracy and reliability’ as a top concern. 2015 is likely to see a democratization of data throughout the organization, meaning that more departments will become adept at using the insights generated by experts. Day-to-day activities will be based on data and the insights created from it.

Rise of sensor-originated data from wearables and the ‘Internet of things’.

Wiki defines the Internet of Things (or IoT) as the interconnection of uniquely identifiable embedded computing devices within the existing Internet infrastructure. For example, your smart watch continuously measuring your pulse while you are running, and prompting you to stop when it senses that your pulse is beating abnormally. The ‘internet of things’ has facilitated the innovation of wearables that can capture data using sensors and communicate it instantly over the internet. A few examples of wearables are fitness trackers, heart rate monitors, and smart watches. These wearables and IoTs will empower humans to take predictive (not just proactive) actions in a timely manner. The sensor based data collection will further boost application of analytics to analyse all these data. However, in the context of wearables and IoT, we are still in the stage of figuring out its possible real-life applications to individuals and businesses. In 2015, the IoT is expected to venture beyond wearables into your homes and surroundings.

Cloud becomes main-stream with greater cloud-based ecosystem.

Cloud has already crossed the stage that IoT is currently in. It has made deep inroads into datacentres, data warehouses, centralized storages, and servers. The cloud ecosystem is likely to penetrate further with the growth of centrally coordinated applications being hosted on cloud infrastructures around the world. 2015 will see horizontal spread of cloud-usage in device convergence and application portability across devices. Strictly focusing on SMEs, companies like Amazon and Google have rapidly matured their cloud-based offerings to SMEs with freemium and usage based models. However, monetization models of cloud based services remain complex. Despite that, cloud adoption is likely to increase among larger businesses as they strive to contain their infrastructure costs. Whereas the smaller businesses will (and probably should) expect the cloud-offerings to improve in terms of security, pricing-models, understanding of its benefits, and real ROI, before jumping the cloud bandwagon.

Better acceptance of open source technology like Hadoop and NoSQL databases.

If there is one trend which has high standard deviation with its long term sustainability, we believe it is this one. Hadoop is becoming popular because of “its ability to store and process semi-structured, unstructured, and variable data”. With the burgeoning unstructured data (from social media), it is no surprise that Hadoop is getting good acceptance among (larger) customers. But we hasten to add that Hadoop and NoSQL may not be in the priority list of most SMEs, simply because SMEs, unlike larger companies, have a tight purse to operate. They already have other higher priority strategies to undertake leaving not much scope for investment in the likes of Hadoop. It would be interesting to monitor and track how this trend pans out in the months to come.

SMEs will incorporate mobile-based solutions in their IT strategy.

A mobile phone is nothing short of a computer these days. Every passing month, millions of consumers are switching to a smart phone and relying on it for their daily chores. Referring a to-do list, searching for a Thai restaurant in the vicinity, buying books or fashion garments, downloading songs, and pretty much every other activity is increasingly shifting to a mobile device. Companies are also reinforcing their online presence with mobile-based solutions. The sale of phablets is likely to grow to 60%; thus SMEs will find it prudent to be in tune with this trend in order to be able to tap tech-savvy consumers.

Optimizing business gains from social media presence.

Businesses see social media as a mechanism to attract more customers, create buzz about their products and services, seek feedback to better customer service, and improve service offerings. Many SMEs seem to employ social media in a disorganized manner rather than design a systematic campaign to deploy a social media strategy for say, digital marketing. They hope that it will help them in some way. Hope is rarely a good strategy. In the coming year, SMEs are likely to rely on social media rather than just use it. However they seem to lack the means or resources to measure the gains from their social media strategy. This is where professional services firms can assist in devising a well-planned strategy to leverage real gains from social media.

Integration woes.

Frankly, we are as surprised (or unsurprised) to see integration woes as an ongoing trend as you possibly are. If there is one trend that has continued over decades, it is this one. Over the years, the ‘entities’ to be integrated have changed but the integration-related troubles continue. In the 1980s and 1990s, integration of legacy systems with open systems gave pain. In the 2000s, integration of different software architectures was cause for grief. Today, analytics tools and techniques are being developed around the Internet of Things, but the integration of these systems is lagging. More specifically for SMEs wanting to embrace analytics, integration of structured, semi-structured, and unstructured data is a source of much anguish. Worse, they typically lack the expertise and resources to manage the entire integration process despite employing a team of analysts. This is another reason that in-house analytics teams are increasingly not being preferred because of the need of specialist treatments of data.

Data security and privacy concerns.

Data privacy and security concern has been one of the main reasons keeping SMEs from adopting analytics. All roads to meaningful business insights lead through your data. You need to share data with analysts and service providers in order to get hidden insights that can be utilized for business benefits. However, SMEs have been wary in sharing their data, probably rightly so, in order to protect their customer identities, even at the cost of losing their competitive advantage to rivals. But now, with increasing number of SMEs taking up analytics to secure and grow their businesses, others don’t want to be left behind. Organizations will increasingly recognize that it is not possible to operate in a 100 percent secured environment. Once organizations acknowledge that, they can begin to apply more-sophisticated risk assessment and mitigation tools. They will look to embed security at multiple levels viz. application-level, execution-level, storage-level, and even contract-level. Interestingly, analytics itself is proving to be a great mechanism for security breach prevention.

Organizations moving away from in-house analytics.

Organizations hired staff to set-up their own in-house analytics teams primarily for two reasons: First, they intended to take up analytics as an ongoing business strategy and thought that hiring in-house analysts was the inexpensive way to achieving that objective. Second, they were guarded about sharing data with external service providers. The arrangement of in-house analytics department should have worked had it consisted of the right skilled-resources, such as data scientists and analytics experts, who came from analytics background. In many cases, these data analysts might have delivered some initial benefits despite coming from the business-side. However, companies seem to have realized that they are spending way too high to achieve that purpose. Not only do they not have the ‘right-skilled’ resources to take up the ongoing analytics challenges, but it also takes their focus away from their core business. Moreover, setting up an in-house analytics team is a costly and risky proposition requiring the necessary infrastructure to operate. Therefore, SMEs seem to be moving away from heavy in-house big data infrastructure to external analytics service providers. In some cases, they are even going for big data-as-a-service in the cloud. This allows them to have a lean in-house analytics team of just analytics officers or data officers and get their stuff done through the external knowledge workers.

In sum, most trends are pointing toward ‘ubiquity of analytics in business’. Which of these trends will realize in a big way in 2015? Our guess is as good as yours! Meanwhile, we would love to know your thoughts on how analytics has contributed to your business in 2014, and more importantly how do you perceive it to perform this year. Please do share!

Related Posts:

<– Buy, Build, or Get the job done?

Most important thing in analytics is not what you think –>


You can also subscribe to our blog – Our Perspectives – to receive interesting articles and tips in email. We would love to read your perspectives and comments on that.

Do follow Veravizion on LinkedIn, Twitter, Facebook, or Google+ to receive easy updates.

Source_references-2

Changing Student Demographics

Veravizion No Comments

U  p until the nineteenth century, higher education used to be pursued primarily by those from elite background. So demographically speaking, young men predominantly from affluent well-connected families largely formed the pool of such students. Many factors have caused this demographic profile to shift from privileged few to general mass. It is anticipated that by 2020, almost 50% of students studying in the U.S. and U.K. universities will be from diverse cultures, backgrounds, age-groups, and nationalities.

Latest UN data indicates that there is a direct correlation between mean-years-in-school and income-per-person (GDP per capita). As shown in exhibit 1, people from developed countries having better avenues at taking up higher education are generally better-off financially. They appear on the upper-right end of the chart. On the other hand, people from poorer countries with lower education levels languish at the bottom-left of the chart. There seems to be a widespread perception that higher levels of knowledge and skills open doors to higher-paying jobs and thus result in better quality of life.
Changing Student Demographics - Mean_years_in_school chart

The outcome is that people from diverse cultures worldwide are pursuing higher education in the courses relevant across the world today. There is an increasing trend to study in prestigious universities in the developed countries, especially in the U.S. and the U.K, for higher education.

Let us briefly analyze how the higher education landscape is panning out in terms of nationality, age, and gender diversity.

Compared to a decade ago, 30% more international students were studying at U.S. colleges and universities, and 5% more international students were studying at U.K. universities in 2011-12 (see exhibit 2 for the trend in U.K. universities). The most noticeable increases in international students are from Asia, the Middle East, and other emerging economies. This trend of greater participation of ethnically diverse population points toward globalization in the education sector.
Changing Student Demographics - International-students_trend over time

There is one other interesting trend that has been noticed recently. Universities in the U.S. are witnessing an increase in the older (typically aged 25-34) students than in the past. In today’s information age, innovation is happening fast and things are becoming obsolete faster. People are feeling the need to learn new technology, new business models, and new skills, to stay tuned with the changing times. This perceived need to keep the knowledge current and to remain relevant in the job market is prompting students from various backgrounds to return to school. These are the older students, a.k.a. students of non-traditional age-group, that could not continue their education earlier due to various reasons such as low income, lack of suitable avenues, family obligations, and other socio-economic reasons. With the advent of internet and online education options especially in the U.S., there are an increasing number of older, even married, students with more varying demographics joining higher education, thereby skewing the overall demographic profile of students. By contrast, universities in the U.K. are experiencing an increase in the number of younger students and decrease in those aged over 30. This may be explained by the fact that online channel as an effective medium of learning is yet to get widespread acceptance in the U.K. Most of the well-known providers of online education today, for example, Coursera, Udacity, and edX, are based in the U.S. Online medium of education is typically preferred by older students having jobs and families.

Finally, gender diversity is playing a big role in the changing trends. Female students are fast occupying the seats in classrooms that once were occupied by their male counterparts. In the latest report published by HESA (UK), more than 50% of students studying in U.K. universities in 2011-12 were female. The trend is not much different in the U.S. universities either. There were interesting trends within region-wide distributions too, such as lower female students population from countries considered conservative. However, in general, there is an evidence of definite increase in participation of female students in higher education.

But why are student demographics important to universities?

Students are the main stakeholders in the success of an educational institution. Students’ curricular and extracurricular activities, interests, and opinions are driven by their beliefs, faiths, likes, and dislikes which in turn are based on their cultures and ethnicity. Thus, their demographic profile directly affects the way their experiences will shape-up in any educational institution. The universities can no longer assume that students from diverse communities will participate in courses and activities traditionally offered by them. This calls for detailed analysis and deep reflection on part of university leaders to design and offer an ideal educational experience for this shifting student demography.

How leaders are acting in response to the changing demographic trend?

The student population will become more ethnically diverse in the years to come. Educational institutions are now getting accustomed to the rapidly changing student demographics in the sector. Leaders from the top universities are making the most of this opportunity by putting in place such mechanisms that will ensure responsiveness to the needs of these new learners. The development of this yet untapped student demography means new avenues of revenues for the universities already grappling with funding issues. One of the first steps the leaders are taking is to institutionalize analytics at individual student and course level. This will help them in the following three ways: First, student-level-analytics includes a well-defined feedback seeking mechanism from students that let the leaders feel running pulse of the students’ preferences, likes-dislikes, and attitudes. Second, course-level-analytics gives inputs on performance of teaching faculties on all courses, research activities, and course-effectiveness index, and checks the courses’ continued relevance. The combination of these two analytics can be very effective in keeping a tab on ‘drop-out-risk’ of students. Last and most important, the leaders now have hard-data to take quick information-driven decisions with less gut-feeling and less uncertainty. Better still, they are able to be accountable with more confidence and can utilize the information to win over their sponsors and stakeholders. They are able to apply it in a day-to-day decision making so that the educational institutions become ready to embrace the future with welcoming arms.

Related Posts:

<– Universities: Funding and ROI challenges

Shifting focus of universities –>

Do follow Veravizion on LinkedIn, Twitter, Facebook, or Google+ to receive easy updates.

Veravizion analytics

Veravizion analytics – A Warm Welcome!

Veravizion No Comments

W  elcome all to the first blogpost at Veravizion analytics!

We are very excited to be able to offer our services to you and to make a sustainable positive impact on your business and on the businesses and lives of those you serve. The opportunities are limitless. We are also thrilled to have the opportunity via this blogpost to share our perspectives and your thoughts on topics that are as much crucial for your business as they are dear to our heart.

All these preceding years, I have observed one thing consistently. Like Newton’s observation, this one too is as common as an apple falling down a tree, and one that most of you have noticed too. However unlike Newtonian one, this one concerns matters of business. It is that, the data and time at hand, for a business executive, are inversely proportional to one another; and the proportion is worsening every passing day. BBC cites IBM to say that, “2.5 exabytes – that’s 2.5 billion gigabytes (GB) – of data was generated every day in 2012.” We are already 700-odd days ahead of that.

The enormity of data carries grave implications for a business (and for our business executive). The top three concerns that instantly come to mind are:
1. Additional cost to analyze the data in a rushed manner
2. Risk of missing the main point
3. Impact on bottom-line and business strategy

From my own professional experiences, I have seen C-suite executives asking senior-managers for instant reports on a variety of business parameters. Naturally, the top-guys need it to keep the business profitable and chart future course of the business. The senior-managers – the business executive in our observation – rarely have an easy way out. So under severe pressure, they are forced to employ resources, at times unskilled, to quickly run queries and generate reports. Many a times, the hugeness of data and paucity of time make the analysts churn out some reports to satisfy the top-execs’ invariably urgent requirements. The entire process becomes quite frustrating and traumatic for the managers. Moreover, there is a high risk of such reports being incomplete and/or inaccurate. It will be nothing less than a gamble to base critical business decisions on such reports. Worse, the managers can be accused of misrepresenting the facts for no fault of theirs.

Fortunately, there is a large upside to this situation. The senior managers can put in place mechanisms, like management dashboards, frequently required charts, and a few useful reports pertaining to any and every information on their customers. These proactive actions on their part can go a long way in helping them and their organization institutionalize a new competitive strategy to keep a step ahead of their competition.

Veravizion was born to help executives with these requirements.

The objective is to have something simple, yet something incredibly useful. These tools can not only save the managers from stress but also help them create win-positions for themselves in their organizations. The business executives can actually differentiate themselves and their organization with this strategy.

I look forward to interacting with you in the coming weeks through future posts and your comments.

1

Most Viewed Veracles

Schedule Your Complimentary Session with us Today!

We promise you will come away with insights on utilizing your business data productively and cost-effectively. This session will be free of charge and there is no obligation.