There appears an increasing level of interest among math scientists to work on topics, like machine learning, that are changing people’s lives through its application in business.
“A topic that is attracting more and more attention is mathematical aspects of machine learning. There are many directions; one that interests me is how I could use some of these exciting new tools in my own research. Another very ambitious and noble goal is to create a mathematical theory of machine learning. When does it fail, and when we can we hope for good results?”
— Maryna Viazovska, 2022 Fields Medal winner, in a Q&A with Nature
This Veracle is about how the mathematicians’ work is instrumental in pushing the boundaries of making data-driven decisions in business.
Let us begin with a little fun challenge: Take a look at the four knights on the cover picture. Can you exchange the positions of the black and white knights on the given chess board?
If you can, then you may have it in you to win the Fields medal.
What is Fields Medal and how is it relevant to business?
The Fields Medal is the most* prestigious award a mathematician can receive. The International Mathematical Union presents the medal to young math scientists for outstanding contributions in mathematics. The Fields Medal is only awarded every four years.
The obverse and reverse of the Fields Medal
This year, four mathematicians are the winners of the Fields Medal. They received their awards earlier this month in Helsinki, Finland.
2022 Fields Medal winners
They have earned this distinguished honour for solving or moving closer to solving longstanding “open problems.”
An open problem is a known stated problem which has not yet been solved. It is assumed to have an objective and verifiable solution.
The answers to open problems pave ways for innovative ideas and possibilities. In business context, these answers facilitate, among other things, making business decisions better and faster.
How is their work exciting and significant?
Business decision making has become too complex. Business executives must consider both qualitative and quantitative information to make decisions.
Qualitative information uses subjective judgements. This includes non-quantifiable data such as employee expertise, people attitude towards change, and company culture among other intangible aspects.
However, quantitative information uses data. Now, organisations have too much data available to them. They have data generated by operational transactions, market research, and external sources. Organisations must analyse this exponentially growing data to make decisions. Moreover, they must make many of these decisions in the runtime.
To that end, businesses need more advanced computational algorithms to sift through zettabytes of data to analyse and arrive at useful insights. The conventional techniques are highly time and cost intensive.
This is where work of the Fields Medallists becomes significant.
How does mathematics help business decisions?
This year’s Field Medallists’ works are centred on number theory, probabilistic theory, and combinatorics, among other more intricate topics.
Here are a few examples of business applications of the topics of their work.
Number theory deals with the properties and relationships of numbers.
It has helped in public key cryptography, such as RSA algorithm. This has enabled confidential communications, digital signatures, and secure online transactions for e-commerce companies.
Probability theory is the branch of math concerned with calculating the likelihood of an event. It has numerous applications in business.
From all kinds of risk assessment and modelling (like that for investment and insurance) to sales forecasting, most prediction algorithms use probability theory.
Combinatorics is the study of objects and connections between them. Simply speaking, it has applications wherever we need to arrange things using permutations and combinations.
One can see examples of combinatorics everywhere. It can help in optimising communication networks and logistics. Combinatorics had a crucial role in manufacturing. For example, modular toy manufacturing.
At Veravizion, we help our clients thoroughly understand their customers. The objective is to devise and implement effective marketing strategies for their business growth.
This involves figuring out our customers’ real target customers, understanding their purchase motivations, performing causal analysis, optimising resource allocations, and in general solving their business problems.
In this process, we apply several techniques such as clustering, regression, optimisation, resource planning, and various other statistical analyses. These are based on pure math and statistical concepts like probability theory, combinatorics, and mathematical optimisation.
Are there any areas of business where you think we can consider using math and statistics?
How else does math help businesses?
* The Abel Prize is also regarded as a top award in mathematics. According to the annual Academic Excellence Survey by ARWU, the Fields Medal is consistently regarded as the top award in the field of mathematics worldwide, and in another survey conducted by IREG in 2013–14, the Fields Medal came closely after the Abel Prize as the second most prestigious international award in mathematics.
Analytics is the process of discovering, interpreting, and communicating meaningful patterns in data. It helps us make decisions based on data and hard facts.
Most companies now use analytics to make data-driven decisions. They expect that good insights can really take their business to the next level.
Unfortunately, good insights rarely emerge.
Is analytics all hype then?
Here is a startling finding.
Research by PwC and Iron Mountain indicates that three in four businesses extract little or no advantage whatsoever from using analytics. According to the study, 43 percent of companies surveyed “obtain little tangible benefit from their information,” while 23 percent “derive no benefit whatsoever.”
Now, everyone and their uncle is claiming to use analytics in their business. If it was really useful, the world’s GDP have gone through the roof.
So, why are businesses not able to leverage analytics?
This HBR article and the PwC research discuss the root cause. Both studies point to lack of the right capabilities and competencies required to make good use of the information companies have.
This finding really warrants the question. What capabilities and competencies do we need to extract real value from data?
In fewer words, what makes analytics valuable and beneficial?
The answer is STATISTICS.
Statistics makes analytics insightful.
Analytics without statistics is bland, blunt, and bootless. It is like Ron’s broken wand in (the Harry Potter movie) The Chamber of Secrets.
Analytics without statistics, at best, gives us dull observations like ‘focus on the millennials.’ At worst, we get costly and impractical recommendations like ‘redesign the entire supply chain.’
This lack of benefits from analytics leaves businesspeople disappointed.
An analysis is ‘insightful’ when it goes beyond the superficial. It gives an accurate and deep (hitherto unexplored) understanding about the subject. Besides, an insightful analysis helps us break our long-held beliefs and preconceived notions that hold us back.
Here are two diverse examples of insightful findings.
Example 1: who revolves around whom?
The western world during Aristotle’s time (c. 384 B.C. to 322 B.C.) believed that the Sun revolved around the Earth. For 1,000 years, Aristotle’s view of a stationary Earth at the centre of a revolving universe dominated the studies of the universe. Surya Siddhanta and later Copernicus’ work showed that it was the other way round. That ours is a heliocentric solar system in which the Earth and the other planets revolve around the Sun.
That is insightful.
Example 2: how do you shave?
Gillette first entered the Indian market in 1984. But they failed to sell razors despite trying for many years. They even launched their newest triple-blade system in 2004. However, sales were flat for a long time. Why? Gillette did not understand the Indian consumers. They had tested the product with only a few Indian Students at MIT and hence had missed crucial insights about shaving habits in India. A large part of Indian men did not have access to running water and had longer and thicker hair (than Americans). Based on these enlightening insights, they launched Gillette Guard for the Indian market, tasted success for the first time, and never looked back.
Connecting the dots…
So, how does statistics make analytics insightful?
It does so by employing systematic numerical methods to analyse enormous quantities of data representative of the entire population. Statistics helps us make inferences on the whole population from those in a representative sample. The representative sampling assures that inferences and conclusions can extend from the sample to the overall population.
Ideally, everyone using analytics must incorporate statistical techniques.
But there is one hitch.
In fact, there are three:
Statistics is complex. If there is one subject which is universally hated, it is statistics. Advanced statistics can get overly complicated. If they must, people use only the descriptive statistics which is easier. They tend to stay away from inferential statistics which is responsible for drawing inferences and conclusions.
Use of statistics needs expertise. One needs in-depth understanding of statistics to be able to apply it completely and correctly. Moreover, there are different statistical techniques for different data types. One must identify the right techniques to use depending upon the nature and quantity of data available. Many a times, we need to apply statistics in multiple stages (like the Bonferroni correction) to get more accurate results.
Building expertise takes time and efforts. Naturally, it is costly. It involves having the right people with deep level of knowledge and experience to apply analytics. Most people stop at the basics.
Due to this, it is rare to see use of statistics in analytics. Hence, despite being beneficial for business, useful analytical insights are hard to achieve.
Thus, analytics without statistics is anything but useful. But analytics with statistics is powerful. It delivers meaningful benefits.
That is why, at Veravizion, statistics is the indispensable part of all our analytics and consulting work.
There are several instances where the right kind of analytics (that include statistics) have rendered spectacular results. Analytics is reshaping industries like retail, consumer goods, healthcare, banking, and agriculture, among others. But that is a topic for another Veracle.
What has been your experience of implementing analytics?
We know that inferential statistics helps people to make intelligent and accurate conclusions about a greater population based on analysis results of a small sample. Simply put, we can make estimations about populations based on a small sample of people.
One example: if we met a small group of doctors and find that the cardiologists among them earned more than general physicians, we could infer that cardiologists, generally, earned more than physicians.
Another example: In exit polls, the pollsters ask a small group of people at polling stations about who they have voted. Based on their responses, the pollsters make a generalised estimation on who is likely to win from that constituency.
However, there can be two problems in here.
Isolated evidence
Random variation
Isolated evidence
The problem of isolated evidence happens when we draw inferences based on only a few cases. Such inferences might not be accurate.
Like the above example, if we happen to know only the top cardiologists who earn high salaries, we might be tempted to generalise that all cardiologists earn high salaries. This is because we personally know a few that earn high salaries. Here, we have isolated evidence of only a few known cardiologists that do not represent the entire population of cardiologists.
In case of isolated evidence, we generalise based on known cases. So, there is an element of cognitive bias. Since cognitive biases strongly influence our decisions, we tend to generalise based on these cognitive biases. It influences so much that we look at every evidence in the light of our cognitive biases.
This problem is more likely to occur in the context of personal experiences.
For example, if we do not have a good experience of a certain product (or a service or an institution), we will desist our friend from using it. Ours may be a case of isolated evidence of bad experience with that product (or service or person). Most other people might have had other experiences. In short, our isolated evidence is not enough to conclude whether something is good or bad.
Random variation
The problem of random variation happens when we have insufficient sample data which may not be representative of the population. Here, we are likely to make inaccurate predictions about the entire population based on inadequate data. In such cases, any observed trend is out of randomness.
Random variation is independent of the effects of cognitive and systematic biases. We must aim to collate sufficient data points to nullify the effect of random variation. In general, the larger the sample size, the smaller the effect of random variation on our estimation. As the sample size increases, the random variation decreases, and the estimation accuracy increases.
In the above polling example, the pollsters may survey only a few people from a tiny number of polling stations. The variation thus obtained is more likely to be random than indicative of the entire population.
Don’t they sound the same?
It is easy to confuse between isolated evidence and random variation.
We can even say that isolated evidence is a special case of random variation.
However, there is one key difference.
Isolated evidence is rooted in the form of personal bias. Whereas the random variation comes purely from inadequate sample data.
That is why isolated evidence is more prevalent in people’s personal experiences. So, a friend asking us not to purchase a product is a case of isolated evidence. The star rating of the product on an e-commerce platform is statistical evidence and solves this problem if the rating is given by thousands of unknown people.
So, the next time we are tempted to make a conclusion based on a small sample size, check whether it is statistical evidence, or a case of isolated evidence or random variation.
To succeed in business and to achieve your professional goals, you need to be able to do two things:
Make the right decisions
To be able to justify the right decisions to stakeholders to take them forward
Making the right decisions helps because it saves time and money. Besides, it helps you avoid heartburn caused by the consequences of making wrong decisions. This is especially true when there is a lot at stake in that decision.
Nonetheless, making the right decisions is not enough.
It is equally important to be able to justify the right decisions to get buy-in.
Why?
It doesn’t matter if a decision is right if you cannot get buy-in to implement it.
Do all situations require decision-making?
No, not all.
There is no decision to make in a TINA (“There is no alternative”) situation.
However, the decision-making process kicks in when you have two or more options.
It becomes hard, complex, and stressful, if the options are similar to one another.
Some examples:
Introduce a new product line or stretch the existing product line.
Whether your company should invest in improving existing technical capabilities or hiring technical talent from outside.
Consulting firms in online retail having to decide whether to advise a client to invest more in technology or in physical stores.
Decision-Making
In essence, the decision making process involves the following five aspects – Objectives, Options, Process, Timelines, and Stakeholders:
Why do you need to make a decision – the objective(s)?
Are your objectives clear? Do your objectives align with those of your colleagues or do they contradict?
What different choices do you have – the options?
Have you considered all possible available options for evaluation? Are these options very similar to one another?
How do you make the decision – the process?
Is it opinion-based (aka gut-feel based) or facts-based (aka data-driven)?
When do you need to make the decision – the timeline?
Is your decision-making quick enough or is it time-consuming?
Who do you need to get the buy-in from – the stakeholders?
Can you justify your decision to the stakeholders to get their approval for implementation?
Ideally, businesses must make decisions that are organisation-objective-oriented, facts-based, quick and efficient, and unbiased. Such decisions are invariably optimal for the business.
However, in real-life business situations, decision-making can be tricky:
The objectives of people involved in decision-making may not always align. Thus, they may not arrive at a decision at all.
Personal biases may interfere with business objectives, so the end decision may be unfairly influenced.
The time taken to make a decision may be so long that the particular business situation itself might change in the course of taking the decision, rendering the decision irrelevant.
The subjective process – basing decisions on people’s opinions rather than data – is difficult to justify to get buy-in.
Thus, in reality, businesses tend to make decisions that are subjective, opinion-based, time-consuming, and biased.
Such decisions tend to be highly sub-optimal. They do not invoke the confidence required to invest time, money, and resources to take them forward for implementation.
A decision made in this manner is full of risk and uncertainty.
Guess what?
Risk and Uncertainty are the two things business executives do not like, and want to minimize.
That is why businesses and other organisations look to external management consultants for help in making decisions.
It helps them manage the risk and uncertainty involved in the decision-making process and in the aftermath.
How management consultants help in decision-making?
Management consultants are extremely objective-oriented. They are adept at working with specific details keeping the big-picture in mind, and leaving out extraneous details.
They are highly analytical. It is their job to ensure completeness and correctness of analysis. They apply specialised skills, tools, and techniques designed to analyze different options. Moreover, they leverage their cross-domain expertise acquired from executing similar engagements from the past.
They bring an external, objective perspective. They trust data and facts more than people opinions. Relying on data removes any personal (emotional) bias.
They are particularly sensitive to the urgency of making a decision. They acknowledge that a timely decision is more important than a perfect one*.
Very importantly, management consultants arrive at a decision in an analytical and logical manner. Moreover, they help in explaining and justifying the decision to stakeholders with the help of facts and data.
A decision made in this manner raises the confidence level to commit organizational resources towards its implementation.
This is why businesses and other organizations hire consultants in their decision-making.
How do you make decisions in your business or professional world?
*One important side-note here:
In this aspect, American decision-making differs from German decision-making. In the American business context, external forces like customer request or market need often guide decision-making. So, they think that it is better to make a suboptimal decision quickly, rather than make a better or optimal decision too slow or too late.
On the contrary, Germans believe that the time allotted to a decision should be determined by the nature of the decision. They believe that it is not dictated by external pressures such as customer request or market need or competitor actions. [Source: commentator John Otto Magee on differences in American and German decision-making process]
You can also subscribe to our blog – Veracles – to receive interesting articles and insights in email. We would love to read your perspectives and comments on that.
Here are the top analytics trends 2017 for businesses based on what industry and our clients are saying.
These trends reveal a pattern similar to the one observed last year. Embedded BI facilitates the analytics of everything on demand. Moreover, application of IoT devices continues to increase rapidly. Gartner estimates that 20.8 billion connected things will be in use worldwide by 2020.
While analytics, IoT and their applications in business continue to permeate deeper, artificial intelligence (AI) and machine learning (ML) is gaining further attention.
Until a few years back, mid-size organizations hardly considered AI as a possible solution to any of their problems. However, the pressure on margins due to increasing competitiveness fueled by online players is making it imperative for all businesses, big and small, to be more efficient.
Besides analytics, IOT, and AI, there is one interesting trend that silently continues to grow and intensify because of how human beings are evolving – the urgent need for clear, relevant, and crisp visualization of data.
According to a research by scientists, human attention span is shrinking so much that even a goldfish can hold a thought for longer. The study by Microsoft says that average human attention span has fallen from 12 seconds in 2000, (or around the time the mobile revolution began), to 8.25 seconds in 2015.
While the comparison with the attention span of goldfish is debatable, the underlying insight – that humans are less attentive than ever before – hardly is. Powerful visualization of information remains the key.
Another trend catching the attention of businesses is the use of predictive analytics. In today’s uncertain business environment, companies want the ability to forecast future business performance based on the past. Predictive analytics tries to answer questions such as: What is likely to happen tomorrow? How can we make the business improve? Consequently, predictive and prescriptive analytics are among the most discussed analytics trends among the professionals.
In summary, smart businesses are recognizing the contribution of analytics (and the associated technologies) in their ongoing success. The top analytics trends 2017 continue to reflect this new reality. Unfortunately, Business analytics talent is scarce. Companies are struggling to hire (and afford) the right people that will help them realize the true benefits of analytics. This makes it ever-more critical to engage with partners that will bring on-board the right combination of computing know-how, analytical and visualization skills, and business acumen.
So, here are the top analytics trends 2017 at a glance. Do read-on, review and respond.
You can also subscribe to our blog – Our Veracles – to receive interesting articles and insights in email. We would love to read your perspectives and comments on that.
Like last year, we bring to you top analytics trends 2016 for SMBs. These trends are based on what industry stalwarts and our clients are saying.
A quick comparison with last year’s trends reveals that some trends continue to evolve. Topics like Deep learning, Self-service-BI, or Cognitive computing are some latest ones being discussed. Nonetheless, others are rapidly gravitating towards some common theme.
One such theme is ‘Big Data Analytics’. More and more small and medium-sized businesses (SMBs in short) are going digital. They are embracing analytics and leveraging their data to turn insights into higher revenues, reduced costs, and overall business growth. According to analysts, the big data analytics market is expected to reach nearly $50B by 2019.
Our Trends focus on the applicability of these technologies to small and medium business (SMB) organizations. As we know, technology plays a vital role in running a business successfully. Yet, some of these emerging technologies are not immediately relevant to SMBs. While it can be helpful to develop an awareness of these technologies, very few SMBs are actually going to use them. For example, the uses of 3D printing or AI in 2016.
This year, we have identified nine top analytics trends that are most relevant to SMBs.
1. More SMBs use analytics for business benefits.
Until a few years back, big data (analytics) was more hype than reality. Google was awash with searches involving keywords centered on ‘Big Data’. However, over the last couple of years, analytics has left the hype curve to provide real value. Today, analytics is everywhere.
Earlier, SMBs were not too savvy about maintaining the data of their customers, product orders, and suppliers. This was largely because of the costs involved in the data storage without the apparent benefit of maintaining the data. However, with the data explosion through various media over the last couple of years and with the availability of custom-analytics providers, they woke to the possibility of utilizing their data for getting answers to some key questions around their businesses. As the benefits started becoming visible – in terms of exponential business growth in a few cases – SMBs started focusing on analytics and become more data-driven to improve their business results.
However, making this data meaningful and easy to understand is still a challenge for many. We think that 2016 will be the year that small-scale analytics will really take off for SMBs, as it allows them to leverage their data from disparate data sources for their business benefits.
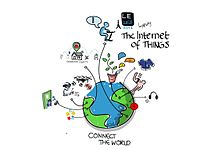
2. Internet of Things (IoT) enters our daily lives.
“When wireless is perfectly applied the whole earth will be converted into a huge brain, which in fact it is, all things being particles of a real and rhythmic whole… and the instruments through which we shall be able to do this will be amazingly simple compared with our present telephone. A man will be able to carry one in his vest pocket.“
How it has become a reality less than a century later!
The Internet of Things (IoT) in its current form proliferated with the surge in low cost sensors embedded with Bluetooth wireless capability onto a small chip. And it is rapidly evolving from the realm of fascinating gizmos to real-world utility gadgets. Many leading companies such as Google, Amazon, Cisco, Dell, and TI have developed their versions of IoT products. There are already some cool IoT devices like Nest, Fitbit, and Belkin, to name just a few, that are vying for consumers’ attention in the market.
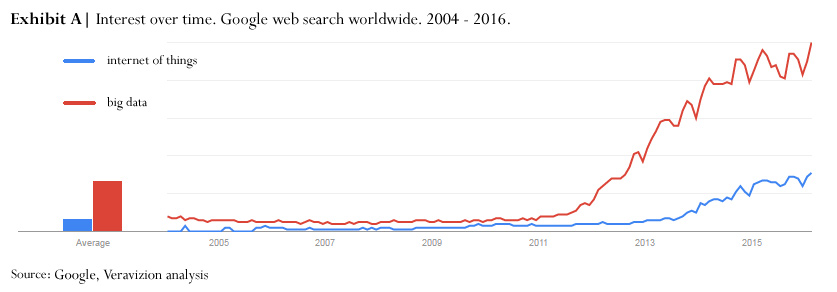
So what’s in it for SMBs?
In terms of Google trends shown in Exhibit-A, IoT today is where big data analytics was around 4-years back. Gartner forecasts that there will be 6.4 billion internet-connected things in 2016. Although the potential of IoT is huge, few SMBs consider it their ‘critical’ priority for investment at the moment. For them, it is still a nice buzzword. There is still time before every visible thing will have a sensor attached to it that will communicate with your servers in real-time. Meanwhile, SMBs are willing to watch and ride the hype-cycle.
3. Predictive analytics to address cybersecurity concerns.
As SMBs expand their technology footprint to run their business operations, the need to secure and protect data grows. Data security and privacy concerns continue to exist among small and large business organizations. However, many SMBs feel challenged and intimidated to deal with the rising complexity of cybersecurity breaches. Companies are normally content with the conventional approach of putting defensive mechanisms to ward off security risks. However, with technology advancements, the security breaches have also become more sophisticated and more risky wherever consumer data is involved.
While large organizations invest heavily into advanced (read: expensive) security mechanisms, SMBs do not have the luxury to do so. Nevertheless, they are now custom-developing predictive analytic models to proactively monitor log files and other user data sources to detect any threat perception or breach alerts. Clustering algorithms can help them identify anomalies in user login or other events which can be recorded on an ongoing basis. 2016 is likely to see an increase in the application of predictive analytics to deal with cybersecurity concerns.
We are entering the ‘smart’ era – smart people working alongside smart machines in smart cities. IDC¹ predicts that companies will spend more than $60 billion on cognitive solutions by 2025. Theoretically, machine learning algorithms based on neural network and AI have existed for a long time. However, their widespread application in everyday life is getting acceptance only now. This is made possible due to the tremendous increase in processing power that enables real-time split-second decision making.
Machine learning algorithms are currently being employed primarily in retail industry. With more people shopping across multiple channels looking for lowest prices, machine learning algorithms will become very popular in implementing dynamic pricing and devising on-the-spot offers in retail stores to retain the buyer.
For example, during this year’s holiday shopping season, leading retailers such as Amazon and Walmart were relying heavily on algorithmic pricing. Both retailers re-priced 15% of 18,000 product SKUs being tracked by a pricing intelligence solution on November 14th alone. These algorithms will be the backbone of any and every e-commerce business striving to win and retain customers.
[Example credit: Forbes]
5. Rising smartphone and tablet penetration continues to increase consumer mobility.
According to a comScore – Morgan Stanley research, mobile users globally have surpassed desktop users at the beginning of 2014. Rising mobile adoption, among people of all ages, impacts consumer purchasing patterns in a big way. With the increasing mobility, SMBs view mobile apps as a way to reach and engage end-users. SMB Group’s 2014 SMB Mobile Solutions Study indicates 59% of SMBs view mobile solutions and services as ‘critical’ to their business.
6. Hybrid cloud options still complex for SMBs.
2015 saw cloud making deep inroads into data-centers, data warehouses, centralized storages, and servers. SMB group’s market study shows that the cloud is poised to overtake on-premises deployment in the next year in areas such as collaboration, file sharing and marketing automation.
However, SMBs are largely using public cloud and staying away from private (or hybrid) cloud options because of the lack of clarity. Microsoft, Dell, and IBM have their own cloud platforms as hybrid cloud options however they do not yet seem to provide a compelling proposition for SMBs to embrace.
7. Omni-Channel integration or cross-device challenge?
Omni-channel is not a buzzword anymore given the availability of multiple screens every customer has. People have indicated that they love to shop across channels. So, more and more brands are going omni-channel way in a bid to woo consumers and to help them buy in their preferred channels. Brands are applying strategies like location based analytics to make relevant offers when consumers are in the vicinity of their stores. Businesses (like Macy’s or Virgin) that offer a unified omni-channel experience to their customers appear to have a competitive edge over others that cannot.
However, in a March 2015 study by Signal, 51% of marketers worldwide reported that they did not have a single view of customers, and only 6% of marketers worldwide reported they had an adequate single view of customers or prospects across all devices and touchpoints.
From our perspective, this year businesses will make this decision of whether they will play the omni-channel game and how.
8. Real analytics talent is (still) scarce.
According to the 2015 MIT Sloan Management Review survey² of business executives, managers and analytics professionals, 49% of respondents, who believe analytics creates competitive advantage for their organization, say that their company lacks appropriate analytics talent. While there is no dearth of analytics CVs in the market, very few of those appear to have real data science skills. In reality, companies need data scientists who possess the rounded knowledge of computer science, algorithms, math-statistics, business, and analytical skills.
Organizations that hire the less than appropriately skilled analysts end up wasting more than just money without any real benefits accrued. This is the reason more than 50% of analytically challenges organizations have stated that they outsource analytical services to external consultants or organizations, according to the survey.
Smart companies are realizing that analytical talent is critical to their success and in short supply, but more than 40 percent struggle with finding the talent they need. There seems to be a growing belief among SMBs that it is best to focus on customers to grow business leaving the necessary analysis tech work to specialists.
9. Visualization will be vital to SMBs application of analytics.
Data and the insights from that data are no more relegated only to the analysts. Business owners and SMB executives want to visualize their data to understand ‘what’s really going on’ in their business. And they want to do it in minimum possible time to be able to focus on the more important aspect of applying those insights for the improvement of their business. Business analytics in the SMB space is likely to stop being just a set of bar- and pie-based charts, and will be more multi-variate and intuitive. SMBs will demand more from the analysts in terms of visualization techniques that makes it easier and faster to visualize, understand, and explore data and uncover real insights from it.
Conclusion
This is an extremely exciting time for SMBs who can now apply customized analytics as per their specific requirements to take their business to a new level in an economical way. We believe this was not an option they previously had. It will be interesting to see how SMBs embrace business analytics to leverage the opportunity and explore unlimited possibilities.
References:
1 International Data Corporation
2 Ransbotham, D. Kiron and P.K. Prentice, “The Talent Dividend: Analytics talent is driving competitive advantage at data-oriented companies,”MIT Sloan Management Review, April 2015.
You can also subscribe to our blog –Our Perspectives– to receive interesting articles and insights in email. We would love to read your perspectives and comments on that.
L ast Friday, I was having a very productive give-and-take with a group of business people on the benefits of business analytics. During our conversation, I had an interesting observation about what those people considered the most important thing in analytics. They seemed to think that data is the most important element in any (business) analytics project. I am sharing here the gist of that conversation. Hope you too find it interesting.
I believe data is the second most important thing in analytics or data science.
The most important thing in analytics is ‘the question to be answered’.
Let me explain why.
Typically analytics initiatives are undertaken to achieve one of these four objectives:
1. To solve a problem
2. To accomplish a specific (business or non-business) goal
3. To prove or disprove a hypothesis
4. To answer a question
Unless you have a specific question that needs answered, any analytics initiative will at best be a random analytical study with no direction. The specific question or the problem statement gives it a definite goal. More importantly, the goal will determine what data to use to arrive at a fact-based conclusion.
I like to think of it as ‘a ship sailing in an ocean’ analogy. An analytics initiative making way through the huge organizational data is analogous to a ship sailing in an ocean. If the ship has a pre-determined destination, then it takes the intended route to reach that destination and achieves its objective. To a bystander, mere existence of a ship creates a perception that it is going somewhere. However, if the destination is not clearly defined, the ship might just have a fun time cruising the ocean and figuring out what the ocean has to show. Worse, it might just flounder in the huge ocean and may not reach any meaningful place.
A ship like that is like a holiday-cruise-liner – expensive to sail but not tasked with any objective to reach a place.
Likewise, many organizations launch their analytics initiatives without any specific target. They just start with a tentative goal of let’s figure out what the data shows along the way. In the absence of any pointed objective to pursue, the analysts running the initiative either have great fun cruising with unbounded data or they just lose their way in it. Such an initiative renders no meaningful results.
An analytics initiative like that ends up becoming an expensive proposition like a luxury cruise-liner.
That’s why the most important thing in analytics is the question to be answered. The question determines what data to use to reach a definitive answer.
For example, to determine an organization’s target customer profile and their buying habits, the customer data will need to be analysed. Similarly, the sales history data will be required to ascertain a company’s sales trends.
The data serves as the route to finding the answer to the question.
The data to be analysed will change with the question to be answered. In our analogy, it is the route taken by the ship to its destination. Different destinations will warrant different routes to be pursued.
The selection of the right data becomes important after determining the objective(s) of the analytics initiative. The right prioritization will not only help you reach your destination faster, but it will also be very cost-effective as you save yourself from expending time, money, and manpower in analysing needless data.
In a nutshell, make sure that you do not end up getting lost in the ocean of data with wrong prioritization. Data-cruising is an expensive way to have fun at the expense of an organization’s usually scarce resources.
You can also subscribe to our blog – Our Perspectives – to receive interesting articles and tips in email. We would love to read your perspectives and comments on that.
Schedule Your Complimentary Session with us Today!
We promise you will come away with insights on utilizing your business data productively and cost-effectively. This session will be free of charge and there is no obligation.