
Customer shopping behaviour is an important concept in retail.
This is why.
How do you grow your retail business? You sell what customers want. How do you know what customers want? Well, you observe how they buy.
When customers buy a product or service, they do certain things. First, they search for the product online or in stores. Next, they try to seek more information and compare prices. Then, they check product ratings and seek feedback from friends. Over time, they engage with brands through social media.
All the actions mentioned above describe customer shopping behaviour.
Customer shopping behaviour in e-retail refers to how customers interact with your website. It involves understanding the actions a customer performs between landing on your website and leaving.
So, how exactly do we “observe customers”?
We do this using the various Key Performance Indicators (KPIs). KPIs help us get a sense of real-situation quantitatively.
Previously, we saw that e-retail and physical retail have different KPIs.
Now, we can measure the customer shopping behaviour in e-retail using the following KPIs:
- Total visits
- Bounce rate
- Shopping cart abandonment rate
- Shopping cart conversion rate
- Sales conversion rate
- Average duration on page
The flowchart in the figure below illustrates these actions. The little boxes on the right of each process show the corresponding KPI.
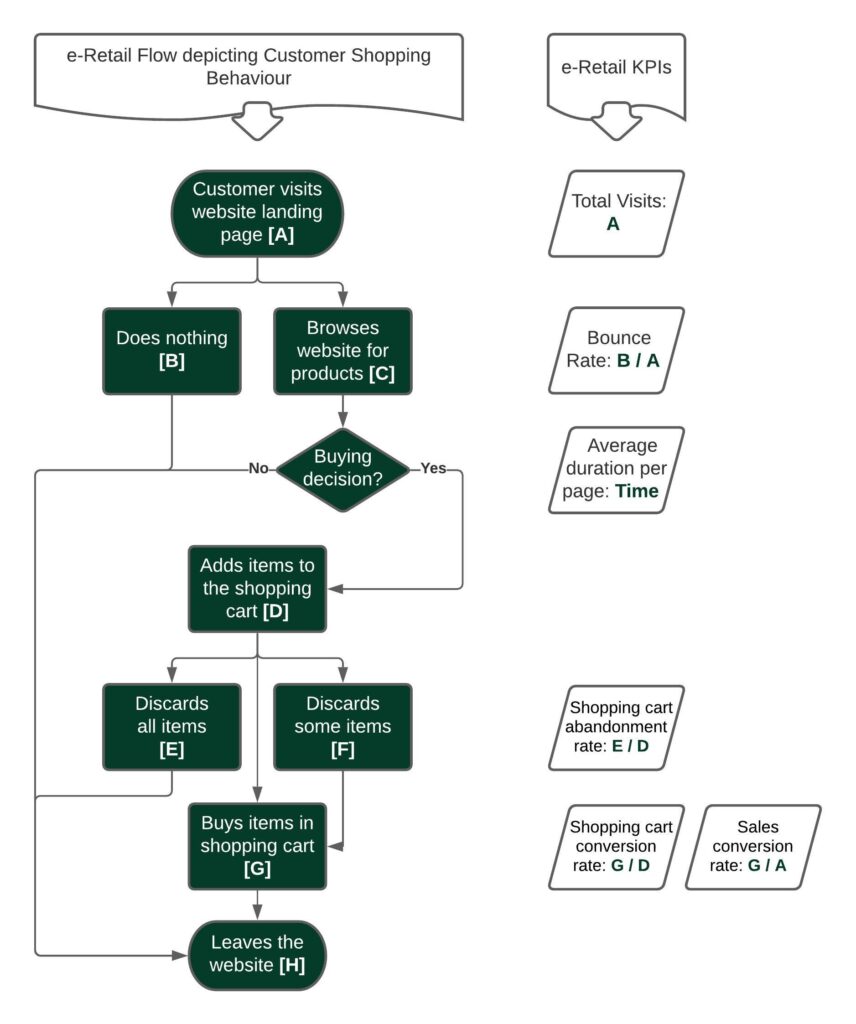
Customer Shopping Behaviour KPIs in e-retail
Here is a brief explanation of each KPI.
Total Customer Visits
Total visits KPI is the total number of visitor landings on a website.
According to Google, 63% of all shopping begins online. That makes ‘Total Visits’ the vital first KPI for an e-retail sale. E-retailers try to increase this KPI to increase sales.
Bounce Rate
Bounce rate is the proportion of visitors landing on your website and leaving without taking any action.
If the website is engaging for customers, they interact with it. More the interaction, lower is the bounce rate, and better are the prospects of making a sale.
There are various reasons for a high bounce rate. Moreover, a high bounce rate doesn’t tell the entire story. Also, there are ways to improve it.
Shopping cart abandonment rate
This KPI means a customer added products in their e-retail shopping cart but later abandoned the order.
According to Statista, 63% carts were abandoned because shipping cost was too high. While these customers have not yet purchased, they are most easy to convert to a sale.
Shopping cart conversion rate
Similarly, this metric helps e-retailers measure the number of completed orders compared to the total number of shopping carts initiated by potential customers.
It is calculated as a ratio of number of visitors who placed an order, to the total number of visitors who started a shopping cart. It is expressed as a percentage.
Sales conversion rate
Google defines sales conversion rate as the ratio of transactions to sessions, expressed as a percentage.
The recent Adobe Digital Index 2020 report pegs average global conversion rate in retail at 3% of the total visits. The sales conversion rate varies across various retail categories. Conversion of consumer electronics is only half at 1.4%. Gifts, and Health & Pharmacy generate the highest conversion rates at around 4.9%.
Average duration per page
One e-retail KPI to measure is the time spent on each webpage. This is tracked as ‘average duration per page’.
This KPIs is based on similar one in traditional retail. In physical retail store, more the time a customer spends inside a shop, higher are the chances of purchase.
So, what do you think? Do you track these metrics? If yes, which ones do you think are the most important for your business?
Related Posts:
- 3 Lessons Every Executive must Learn from Wimbledon Centre Court
- Why your Business should go Digital
- e-Retail Innovations – How e-Retail is Changing?
<– How E-Retail KPIs different from traditional Retail KPIs?
Online Business Growth – The Easy or The Right Way? –>
Author: Sumit Patil
If you liked reading this article, then please subscribe to our blog – Veracles. That way, you can receive such interesting insights in email.
Also, please do follow Veravizion on LinkedIn, Twitter or Facebook to receive easy updates.
Cover Photo courtesy: Luke Chesser on unsplash
2 Comments
Ajit A Deshmukh
September 29, 2020 at 8:15 amVery well explained e-Retail KPIs. If i can suggest, can you write next article on ” what are the different ways/methods to improve those KPIs” e.g. some best practices, Dos and DONTs, etc.? Thanks!
Veravizion
September 29, 2020 at 2:33 pmThank you Ajit!
Sure, we will bring one Veracle soon on the topic you have mentioned. Thanks for your suggestion.